Product teams and marketing teams continually use data to drive decisions. But what about us as software engineers? What can we do with metrics, besides just pulling them in for somebody else?
“You mentioned beer. I was led to believe there would be beer.”

People like Guinness… a lot. By 1914, their annual output was almost a billion pints.
That’s going to need a lot of quality control. So clever Mr. Claude Guinness decided to hire smart graduates to do this work, sort of like tech companies do now.
See the guy in the photo? That’s Billy. Or William Sealy Gosset to his less-intimate friends. “An energetic — if slightly loony — 23 year-old scientist”.

To help him maintain quality over a billion pints, our friend Billy invented a way to answer important questions, by taking small samples of beer and using some smart math. The methods invented by our clever Billy became the fundamental basis for how doctors decide if a new drug will save you(or kill you), how Facebook decides how to manipulate you, and a zillion other out of this world uses.
“What does this have to do with code?”
Bitbucket (and the rest of the company) has a big push on performance. On the frontend, we’re making a number of changes to boost performance of the Pull Request page. In particular we want to speed up rendering the code diffs.
Rendering the diffs uses a Chunks component which renders a great many separate CodeLinecomponents.
I wondered, could we speed this up by merging the CodeLinemarkup directly into Chunks?
But that reduces modularity and possibly maintainability. Since there’s a cost, I want to know there’s a real benefit to rendering time. But how do I tell? All I have so far is an idea.
Sure, I could load the Pull Request page a couple times before and after the change. But that’s hardly a rigorous check, for many, many reasons. And it’s going to be hard to tell, if the improvement is small (but real).
“Now tell me more.”
I needed something better than refreshing my browser a couple times. So, I used Lighthouse, an awesome tool for measuring frontend performance and collecting metrics. And it’s now available for the command line.
I wrote a ‘custom audit’ that let me measure diff rendering times for the Pull Request page, and a batch tool for executing multiple runs. Hooray for reliable frontend metric gathering!
In this instance, the audit measures our diff rendering time. This is shared for everyone’s enjoyment (everyone loves code right?) but bear in mind this was written as an internal dev tool. Production code would have things like nice error handling. Also note that this is for v3.2.1 of Lighthouse.
First, the code you are measuring should mark and measure User Timing events for Lighthouse to pickup:
performance.mark("DIFFSET.RENDER.START");

(...time passes..)

performance.mark("DIFFSET.RENDER.END");
performance.measure("DIFFSET.RENDER.DURATION", "DIFFSET.RENDER.START", "DIFFSET.RENDER.END");
Next, the custom audit.
// diff-rendering-only-audit.js

'use strict';

const { Audit } = require('lighthouse');

// Custom audits are provided to Lighthouse as classes
class DiffRenderingOnlyAudit extends Audit {

 // Tell Lighthouse about this audit
 static get meta() {
 return {
 id: 'diff-rendering-only-audit',
 title: 'Diffs rendered',
 failureTitle: 'Diff rendering slow',
 description: 'Time to render a diffset',
 requiredArtifacts: ['traces'],
 };
 }

 // Lighthouse will call this static method
 static audit(artifacts) {
 return new Promise(resolve =\> {
 getAuditResult(artifacts, resolve);
 });
 }
}

// Lighthouse produces a 'trace' of the page render.
// Process the trace to get the timing information.
async function getAuditResult(artifacts, resolveAuditResult) {
 const trace = artifacts.traces.defaultPass;

 const tabTrace = await artifacts.requestTraceOfTab(trace);
 const duration = extractDuration(tabTrace);

 // Tell Lighthouse the result
 resolveAuditResult({
 rawValue: duration,
 displayValue: duration,
 score: 1,
 scoreDisplayMode: 'manual',
 });
}

// Compute the duration of the specific User Timing measurement
function extractDuration(tabTrace) {
 let duration;

 // Find the User Timing measurement event
 const durationEvents = tabTrace.processEvents.filter(
 event =\> event.name === 'DIFFSET.RENDER.DURATION'
 );

 // Lighthouse records 'begin' and 'end' events for a measure
 const begin = durationEvents.find(event =\> event.ph.toLowerCase() === 'b');
 const end = durationEvents.find(event =\> event.ph.toLowerCase() === 'e');

 // Event duration in milliseconds
 duration = end.ts - begin.ts;
 duration = Math.ceil((end.ts - begin.ts) / 1000);

 console.info('\>\>\> Diff Rendering Only duration (ms): ', duration);

 return duration;
}

module.exports = DiffRenderingOnlyAudit;
Create a config file for Lighthouse that runs the above audit.
// example-config.js
module.exports = {
 extends: 'lighthouse:default',
 settings: {
 throttlingMethod: 'provided',
 onlyAudits: [
 'user-timings',
 'diff-rendering-only-audit',
 ],
 emulatedFormFactor: 'desktop',
 logLevel: 'info',
 },

 audits: [
 'diff-rendering-only-audit',
 ],

 categories: {
 pullRequestMetrics: {
 title: 'Pull Request Metrics',
 description: 'Metrics for pull request page',
 auditRefs: [
 { id: 'diff-rendering-only-audit', weight: 1 },
 ],
 },
 },
};
Run the above audit once.
lighthouse \<your url\> --config-path=./config.js --emulated-form-factor=desktop --chrome-flags="--headless"
Next, an example node script to batch run the Lighthouse audit.
const commandLineArgs = require('command-line-args');
const lighthouse = require('lighthouse');
const chromeLauncher = require('chrome-launcher');
const log = require('lighthouse-logger');
const { mean, sampleStandardDeviation } = require('simple-statistics');
const lighthouseConfig = require('./config.js');

// Command line arguments
const argsDefintion = [
 // n: number of runs to execute
 { name: 'n', type: Number },

 // url: url to test against
 { name: 'url', type: String, defaultOption: true },
];
const args = commandLineArgs(argsDefintion);

if (!args.url) {
 console.error('No url specified');
 return;
}

const lighthouseFlags = {
 logLevel: 'info',
};

go();

async function go() {
 const n = args.n || 10;
 const diffRenderTimes = [];

 // Launch Chrome
 const chromeFlags = ['--headless'];
 const chrome = await chromeLauncher.launch({ chromeFlags });
 lighthouseFlags.port = chrome.port;

 // Run lighthouse n-times
 for (let i = 0; i \< n; i++) {
 console.log(`Start run ${i + 1}...`);
 diffRenderTimes.push(await runLighthouse());
 }

 // Compute statistics
 console.log('All render times:');
 console.log(diffRenderTimes.join('\n'));
 console.log('MEAN (ms):', mean(diffRenderTimes).toFixed(2));
 console.log('SD (ms):', sampleStandardDeviation(diffRenderTimes).toFixed(2));

 await chrome.kill();
}

async function runLighthouse() {
 const results = await lighthouse(args.url, lighthouseFlags, lighthouseConfig);
 delete results.artifacts;

 return results.lhr.audits['diff-rendering-only-audit'].rawValue;
}
Finally, run the batch script.
node batch.js \<your url\> --n=\<the number of executions\>
Running my new custom Lighthouse audit gave me these two sets of numbers (rendering times in milliseconds):

So, the average time is lower by ~5%. Hooray!! All is well!
“But not so fast… the average isn’t a lot lower, and the rendering times are all a little different. How do you know this shows a real improvement?? And also, get back to the beer.”
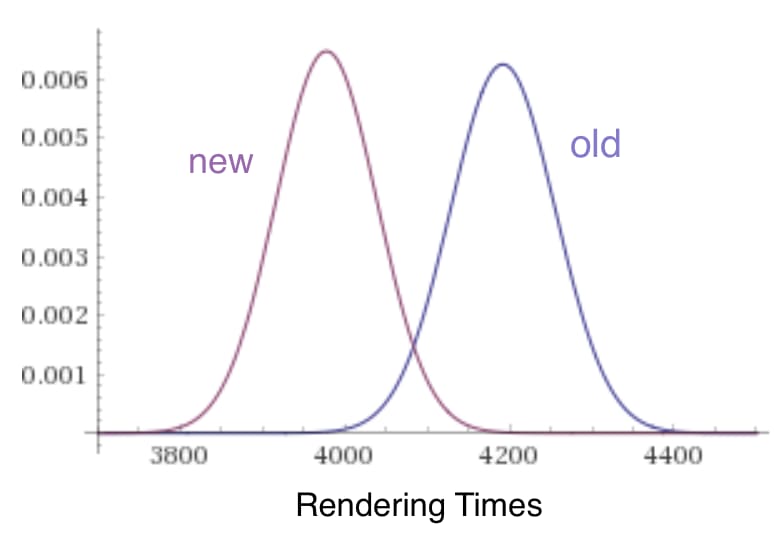
You got me! And well spotted! This is the core of the question! The rendering times are all a bit different. I need to be confident the improved rendering time isn’t just a random quirk of this sample.
Luckily our friend Billy the beer brewer gave us a tool called the t-test. This is how Billy worked out which supply of hops would give him the best beer!
It lets me ask: Given the amount of ‘noise’ in my example rendering times, is this difference between the averages likely to be a real difference or just a random fluctuation? The phrasing you hear is: is it significant?
Using Billy’s tool, I get these two values:
t = 10.5457, p < .0001
This tells me: The probability that my improved rendering times came from random chance are less than one-in-ten-thousand 1 . I can conclude: the code change gives a speed improvement that averages only ~5%, but it’s highly likely to be a _real _5% **.
** Caveat: I’m glossing over a LOT of details around good experimental design. This is just highly simplified example! And FYI, results in the real, non-dev, world (medicine, etc.) are never as neat as in this example. They show a lot more noise.
“What’s the takeaway?”
This post is about opening developer eyes to the connection between statistics and coding. (It’s not meant to be a detailed how-to.)
The core message is: use the power beer gave us to make data-driven code decisions.
Many small improvements in performance can add up to big improvements — as long as those small improvements are real and not just random quirks. To make sure they’re real:
- Collect metrics from your own code.
- Run significance tests to see if you’re making a real difference.
“So, can I have a beer now?”
Yes.
This post was written by Christian Doan — “I’m a Senior Developer on Bitbucket frontend team. My current project is migrating legacy code to a modern SPA stack. I’m passionate about great user experiences and fast performance. Connect with me on linkedin.”
Originally published at bitbucket.org on February 26, 2019.

Top comments (0)