Effectful Debugger is a VSCode plugin for JavaScript/TypeScript debugging. Besides the typical debugger's features, it offers:
- Time-traveling
- Persistent state
- Platform independence (one debugger for node, all browsers, embedded engines etc)
- Programmable API
- Hot mocking of functions or even parts of a function
- Hot code swapping
- Data breakpoints
If you debug a lot, you often encounter a situation when you need to go a few steps backward to see your program's state before. These include variable values, object properties value, DOM, and so on.
If your debugger supports time-traveling, you can stop execution at any time and step backward. The feature helps a lot, especially if this particular application state is hard to reach. For example, you may need to re-press the necessary combination of keys, reset the DB state to some specific values, etc.
All operations changing state are stored in a trace. The trace is used for restoring some past states. This looks like running an application in a reverse direction, including breakpoints.
The whole application state can be saved and loaded back. And the application can even continue execution from the point where it was saved.
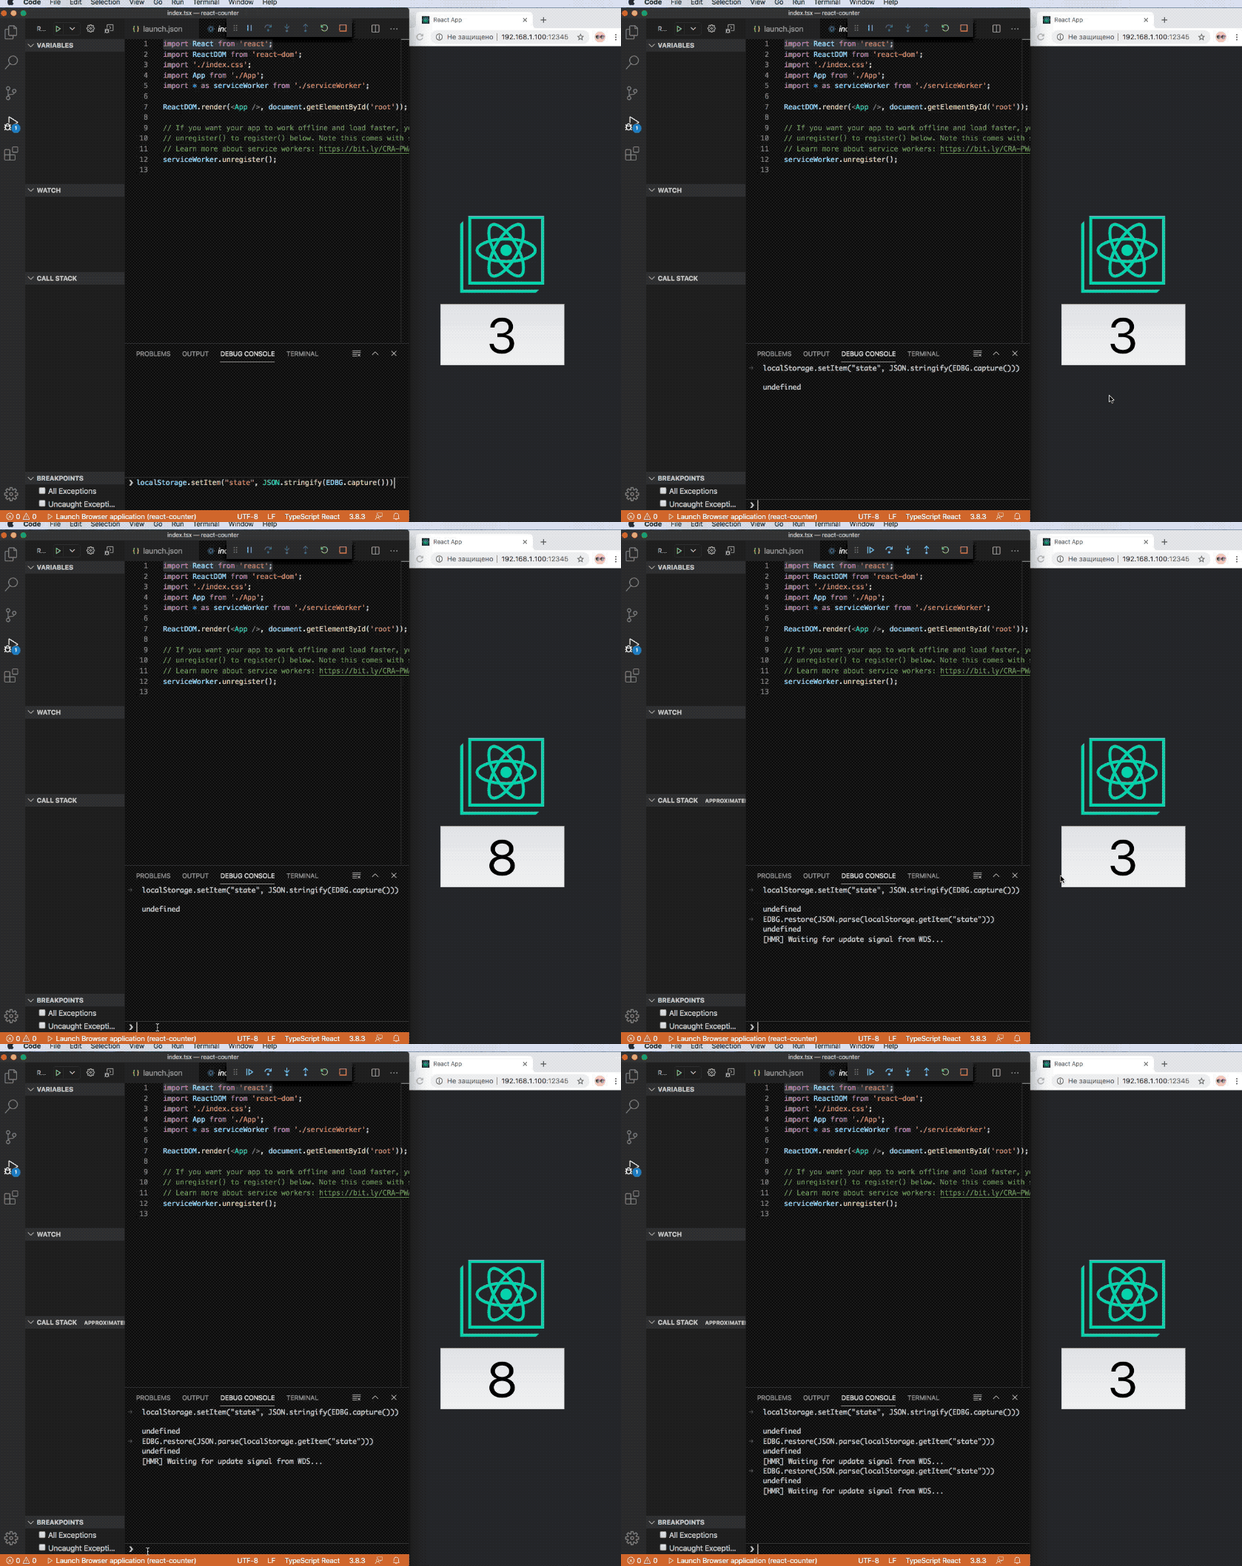
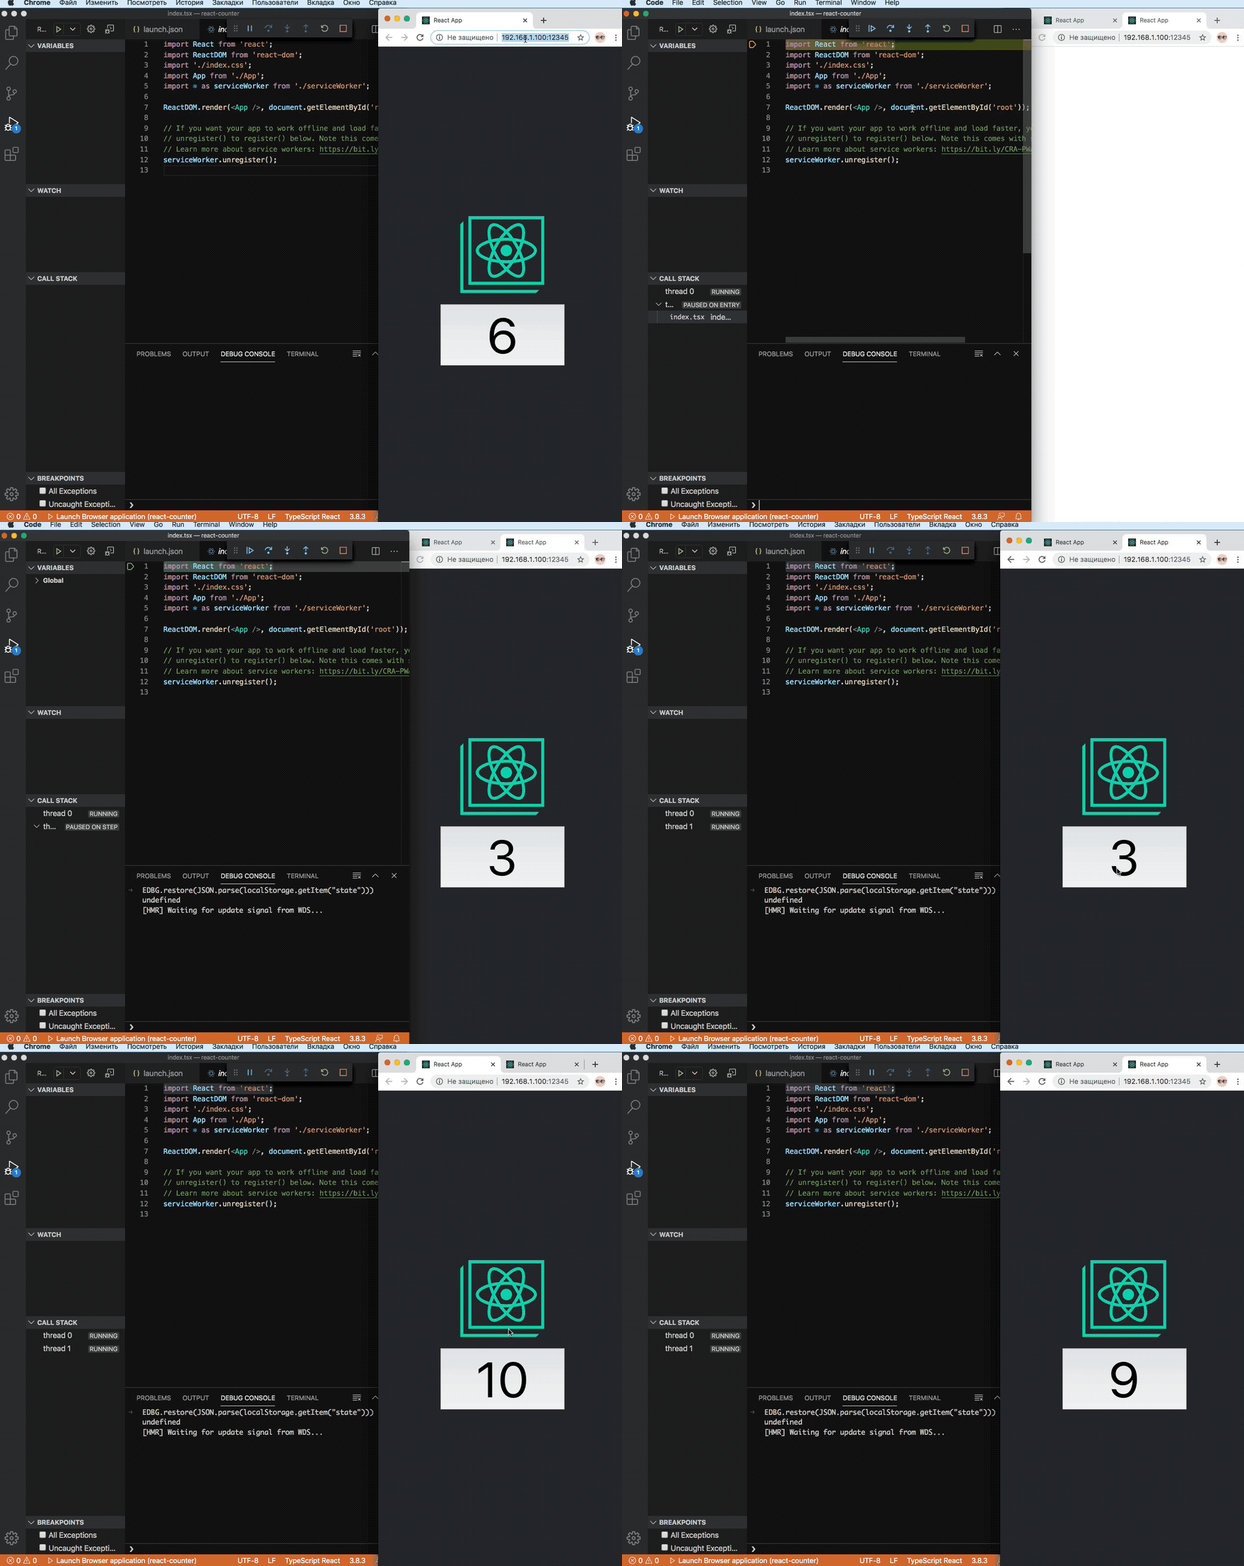
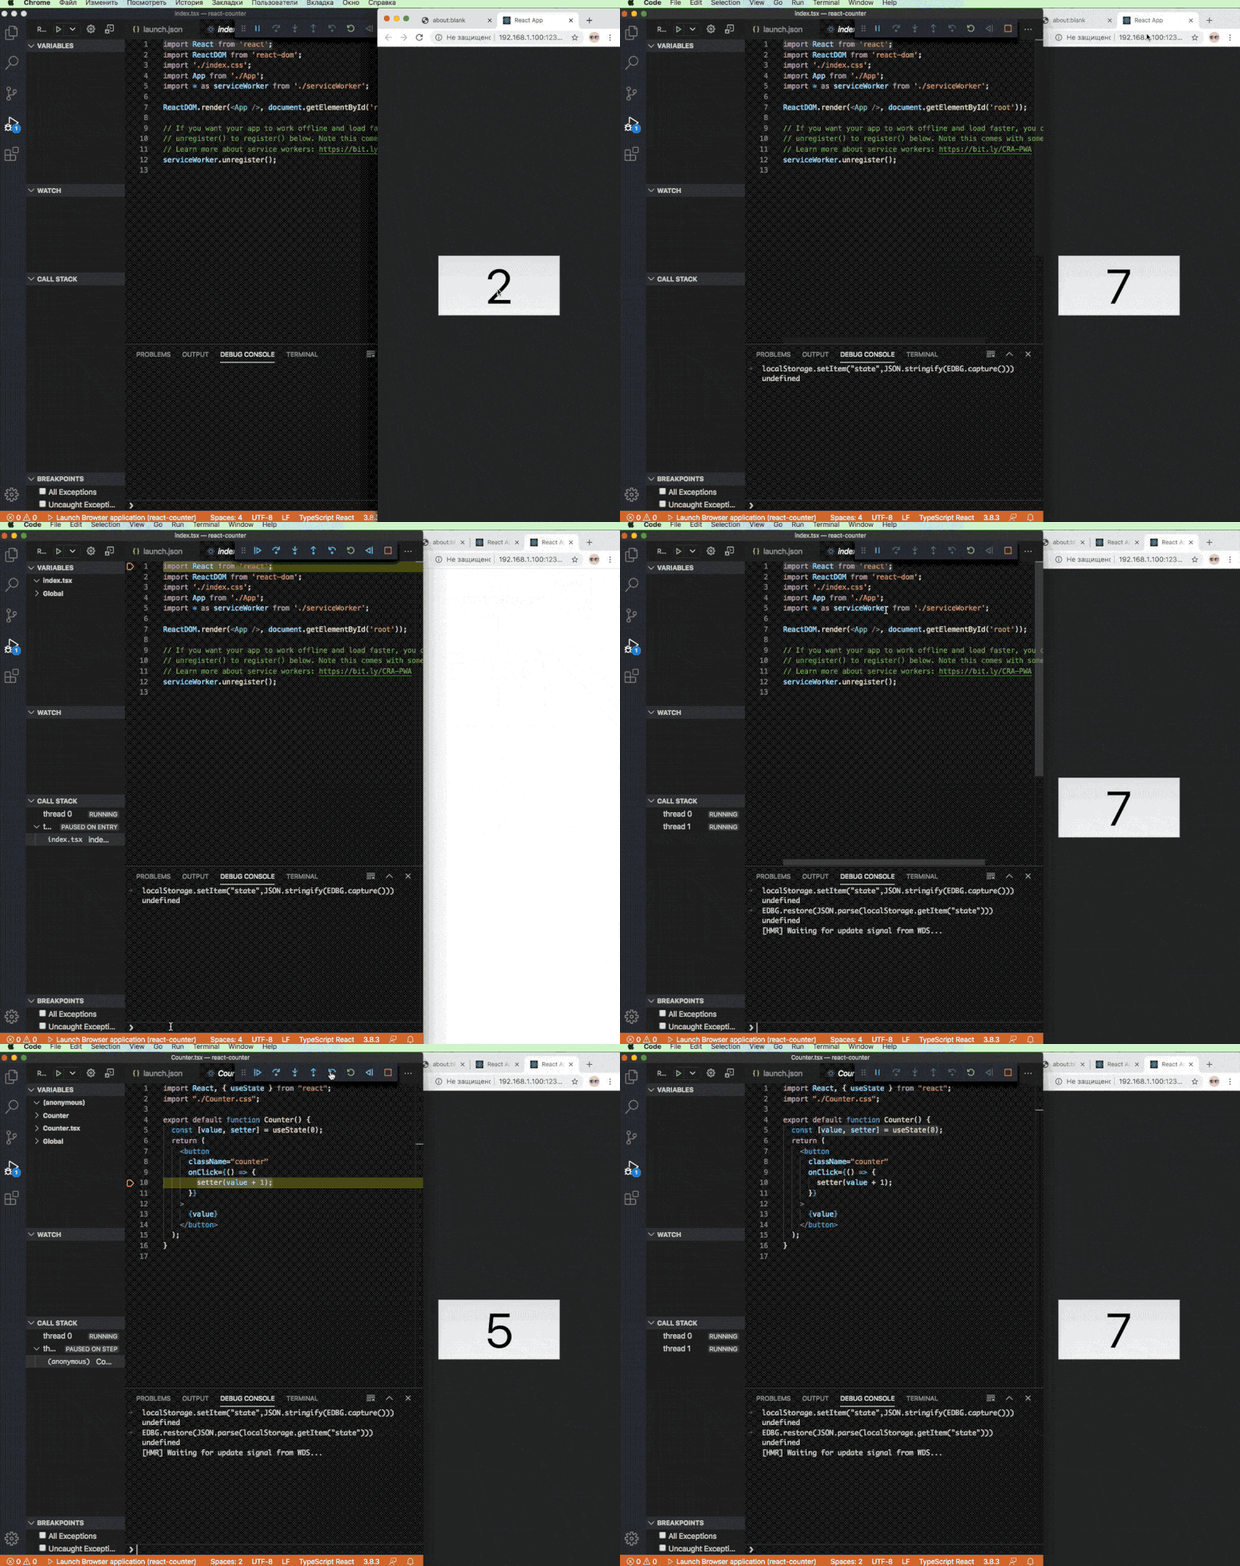
EDBG.capture API function return JSON.stringify serializable object. The same object passed to EDBG.restore resets the application to the captured state.
We can even duplicate the state, opening another clone of the application, while the old is still running. The two applications are displayed as threads in VSCode.
All the variables, including the closure captured ones, are stored and restored too.
The time-traveling trace is stored/restored with EDBG.capture/EDBG.restore functions too. We can use this for post-mortem analysis, and we can even resurrect the program.
The code can be changed while the application runs.
Hot swapping will work better in some next version. Now, only small changes will be updated without a problem. A better solution is just re-run a chunk of code from some point. It is also possible to set up some more complex strategies using APIs.
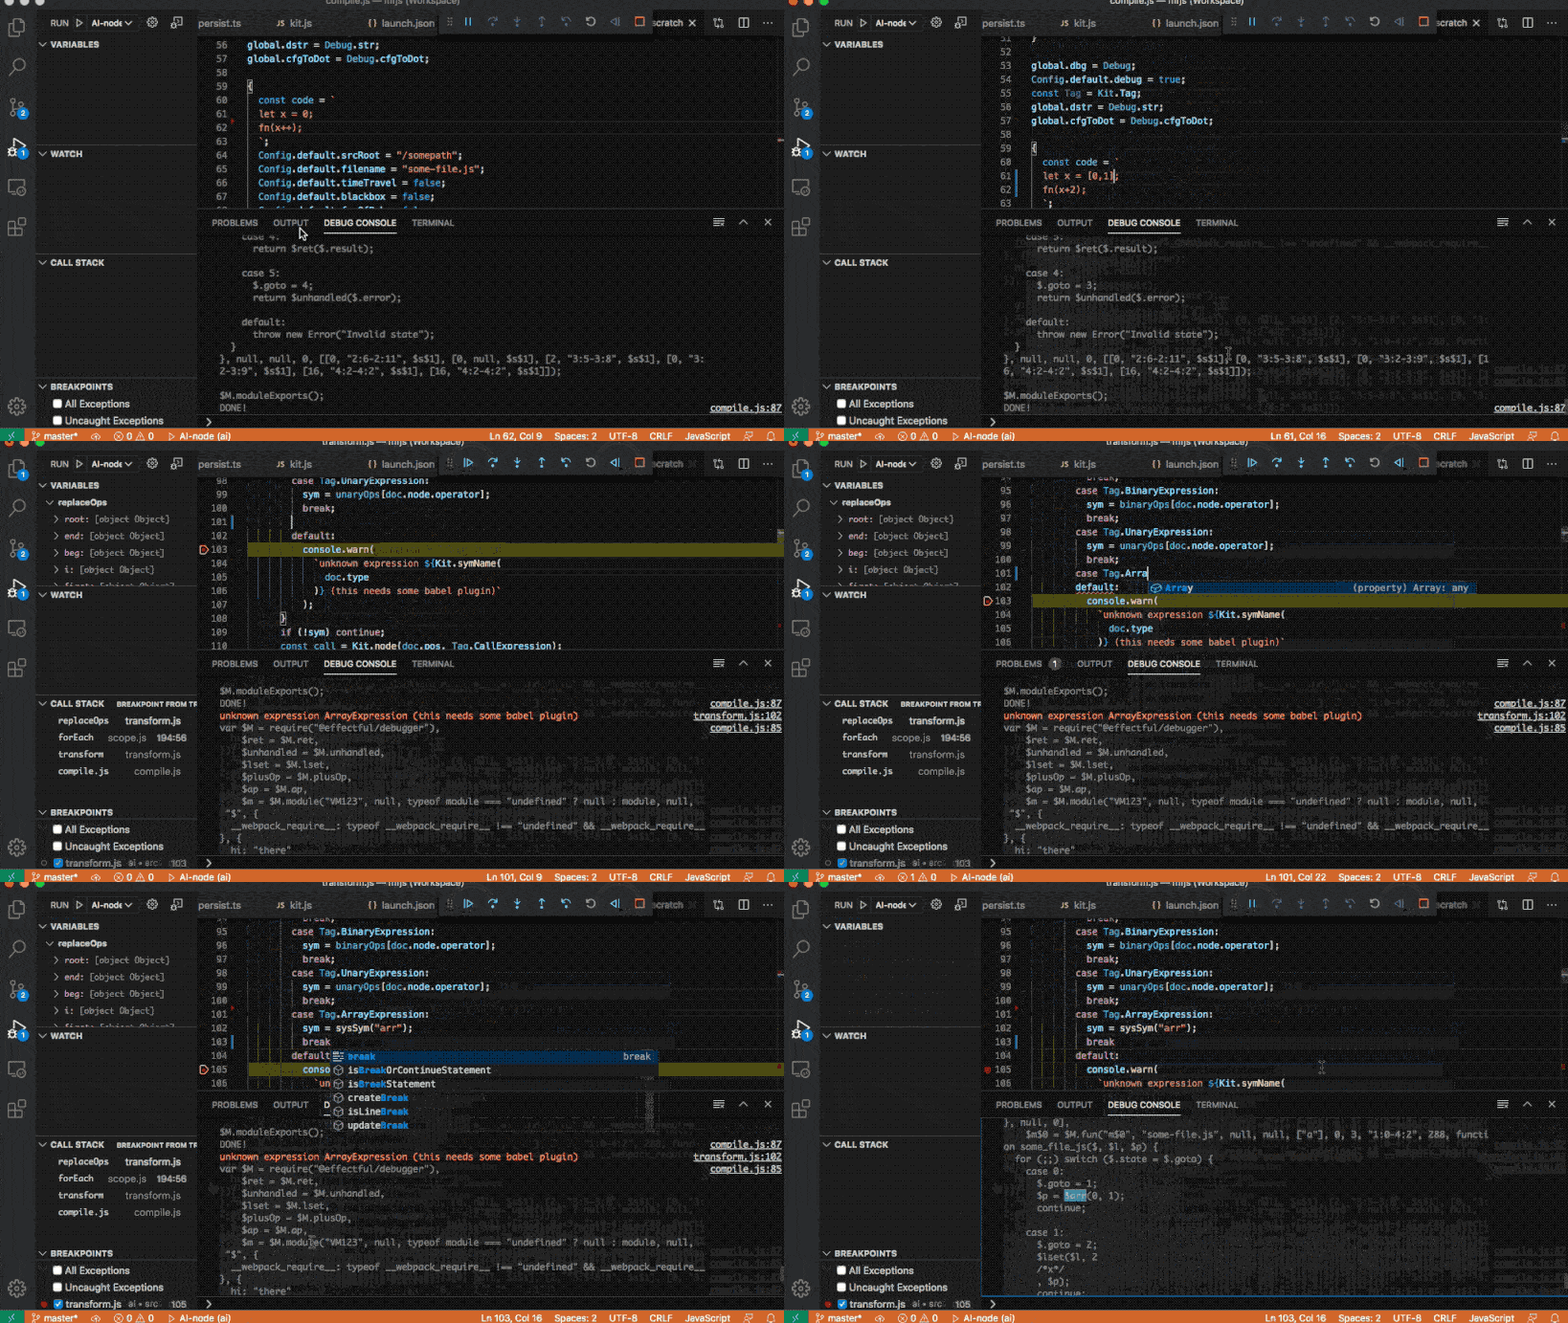
Here I develop while the debugger runs. I get results immediately after any file is changed in case of any problem, I just set a breakpoint and run backward and fix a problem, getting results immediately again. In this demo, it was missed case in switch. It took a few seconds to go to the exact execution location, with correct variable values. This increases productivity a lot.
If you ever wondered what changed your program state (including variables of objects fields, arrays elements, etc.). If your debugger has data breakpoints and time-traveling, it is enough to add a breakpoint and execute it backward.
How it works
EffectfulJS is a JavaScript transpiler for adding any computational effect into the language without changing its syntax. We can use this for debugging applications only if they don't use EffectfulJS. It transpiles all the sources (including dependencies) and injects debugging instructions. They implement VSCode debugging protocol and also collect traces with current variable values, DOM and external function calls.
Since the debugger transpiling sources, this adds extra code. It is slower than executing without the debugger. However, using debuggers speed ups development a lot. There is no need to restart anything. Programs can be debugged even after it returned some results. With fast-restart, only a necessary part of the program will be re-executed and so on.
I already use this debugger in my React, NextJS and Node projects and it helps a lot, but it is in an early stage. Some JavaScript standard edge cases don't work correctly, and it could have better performance.
Please let me know if you are willing to contribute. These might be anything from its issues list with debugger tag or anything else you think is more useful.


Oldest comments (0)