To skip the following anecdote about the journey to my first project please scroll to the third section of the post, otherwise please continue.
Some background
I'm not a programmer.. well I wasn't until recently. I have been fumbling around with the learning for a few years. Jumping from online course to MOOC to textbook back to another online course, all promising to get you to the skillset of a full-fledged software engineering degree. I followed the computer programming hype and then data science hype but never really got anywhere. After a break in my constant cycle of false starts, I read somewhere while trying to find the motivation to keep learning that 7% of people who start an online course actually finish. Now that's some motivation !! -__- As I was about to give up and return to my boring day job, the author pointed out something. Software engineering is hard, it's frustrating, and you most likely won't enjoy the process until you see your results. If you want to succeed with these bleak prospects, you need to understand your why. Simply put, why do you want to be a computer programmer? My first thought was I want to make more money duh but in reality, I make a decent income at my day job and I've been set up to make more so that's not it. After searching my soul for what felt like ages I found it. There's something alluring, mystical, and sometimes magical about being able to will something into existence. Plain and simple: I want to create. I want to take ideas, synthesize the parts, and say!

With that realization I was on fire, motivated, excited! So I ran off, sat down at my computer, opened up some rando IDE, and BAM! Roadblock. How the hell do I build a program? For all the "hello world!"s and for loops, I'd never actually written something outside of a browser hosted, perfectly set up, answer provided environment. Let's quickly jot down my situation, at least one of which we all can relate to.
- No technical background or background in gaining technical skills to actually use.
- My network was 100% Finance and Business people so no one to reach out to for help.
- Self-learning fatigue, so much fatigue, endless fatigue.
The Solution - Mentorship
But not just any mentor, someone who has struggled and fought their way from obscurity to that coveted position of 'Senior Current Hype Language Engineer' @ 'Silicon Valley Unicorn Startup'. Delusions of Grandeur. So begins my pattern, I run off, sat down at my computer, searched "python programming mentor", and BAM! Roadblock. All I saw was bootcamp this, pay money program that. Dejected once more, I thought maybe I should just ask how to find a mentor. Some great answers were "Leverage your network", "Post some projects online and ask for feedback so it'll develop naturally", "Attend workshops at your local meetup". All of this great advice was seemingly contradictory to the aforementioned list of personal struggles. So still, dejected. Not one to be defeated, I tried one more search "Chicago Python Mentorship Program". Then stepping out from the white noise like an answer to all my struggles in my coding journey was ChiPy Mentorship Program. Besides all the hyperboles, this really seemed like the perfect program for me. Free mentorship program, a community of Python developers, volunteers looking to help out folks like me. I applied, I got accepted, and now we're finally at the whole point of this post.
Struggling through my first project!
The idea
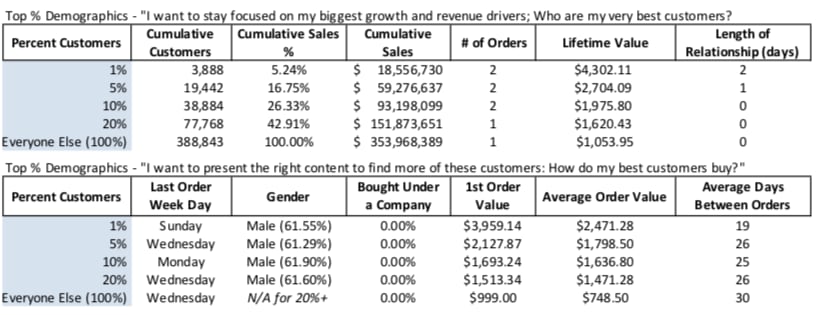
My current company focuses on creating integration and analytics solutions for the e-commerce industry. The value proposition is that we turn Data into Insights, Insights into Actions, and Actions into Growth for your business. We have a consulting report that we've built called the 80/20 RFM and Segmentation Report which is a fancy title for showing your best customers based on their transactional data.
This report is generated from an excel sheet that sometimes takes weeks to finish. Figured this would be a perfect fit for my first project. I know what it should look like and I have the domain experience to understand the mechanics behind it. I also have a clear pathway to iterate on it as I improve my skills. The general idea is that you take the transactional history of an online store and run it through the formulas to produce insights about the performance of the store.
Requirements
- Find the top 1%, 5%, 10%, and 20% of customers based on their purchase history.
- Determine the characteristics of each segment. (Lifetime Value, % of Sales)
- Determine the characteristics of the full data set.
- Create the RFM Score for each client.
- Perform a cohort analysis to uncover insights.
- Present this data in a digestible format.
These are columns that I'm working with:
Index(['customerId', 'name', 'companyName', 'customerGroup', 'city', 'state',
       'country', 'email', 'totalAmountOfOrders', 'ordersCount',
       'firstOrderDate', 'secondOrderDate', 'lastOrderDate',
       'averageDaysBetweenOrders', 'firstOrderAmount', 'secondOrderAmount',
       'lastOrderAmount', 'averageOrderValue', 'createdAt'],
      dtype='object')
At surface level, this all sounds easy. Format the data, do some math wizardry on the columns, assign out the labels. Let's talk about the challenges.
The Challenges and the mistakes I made along the way
- Every store is different so every input is different so my program has to be flexible.
- I fired up a Jupyter notebook and quickly ran through all the math needed to create the report on one dataset.
- It didn't work on the second dataset.
- You can't divide by zero.
- Null values, so many null values.
- I didn't start by cleaning the data so the math constantly failed.
- Jupyter Notebooks does not equal a program.
- What is Github?
- How do you set up a file to be run?
- Is there a PyCharm for dummies?
- Am I writing a script or am I writing a program?
- I wrote something that worked once but needed to work repeatedly.
- Datasets with thousands and sometimes millions of rows do not play well with for loops.
- Imagine writing a for loop that needs to run over 22 columns and 700,000 rows and your battery dies halfway through it.
- After figuring out all the data in the report I realized that half of it is useless walls of text.
The fun stuff, the code
To prevent this blog post from becoming an book I am going to focus on a particularly challenging part of the program, the RFM ratings.
from datetime import datetime
from datetime import timedelta
import pandas as pd
import numpy as np

def file_read(file):
    """
    Function meant to read in any file at any location
    """
    rfm_file = pd.read_csv(file)
    print(rfm_file.columns)
    return rfm_file

def fix_null(df, column):
    """
    Removes any null values in the columns we need to calculate on
    """
    df.loc[df[column].isnull(), column] = 0
    return df
def date_conv(x):
    """
    Converting the order columns to date time objects
    when running the function originally it turns out it wasnt clean
    so had to account for missing data and then account for other data types
    """
    x = str(x)
    date_format = "%Y-%m-%dT%H:%M:%SZ[%Z]"
    date_format2 = "%Y-%m-%dT%H:%MZ[%Z]"
    if x == "nan":
        return "Missing Order Data"
    else:
        try:
            datetime_object = datetime.strptime(x, date_format)
            x = datetime_object
            return x
        except:
            datetime_object = datetime.strptime(x, date_format2)
            x = datetime_object
            return x
def prep_file(file_loc):
    """
    """
    rfm_report = file_read(file_loc)
    report_columns = rfm_report.columns
    fix_null(rfm_report, "totalAmountOfOrders")
    fix_null(rfm_report, "ordersCount")
    rfm_report["firstOrderDate"] = rfm_report["firstOrderDate"].apply(date_conv)
    rfm_report["lastOrderDate"] = rfm_report["lastOrderDate"].apply(date_conv)
    return rfm_report

rfm_report = prep_file("/Users/dougdotts/Downloads/rfm.csv")
The goal of this section of code is to clean the data. The challenges mentioned before all started here. A little gem that I learned in one of the many courses I had taken was creating functions for things that wanted to do in multiple places in the program. This vague reference led me to Functional Programming. From my limited understanding, I gauged that the functional programming paradigm would allow me to write code that does one thing and one thing well, which I heard somewhere is important for clean code.
The file_read function was easy enough, take my original snippet and just convert it to accept variables. That's where the easy part ended. You would think that if you were using a dataset about order history then all the order related columns would have data. After banging my head against the wall about unnecessary errors, I ended up with common cleaning tasks that could be applied to multiple columns. Hence fix_null and date_conv. Something to note about cleaning up columns, a lot of the more useful libraries only work on strings. I then made it easier by creating a function to call all the other functions, prep_file.
Lesson 1: Don't assume your data is clean, take the time to go through to see if it is in a usable format. This will save so much time trying to debug code that technically should work. Bonus: If a column is two different formats, pretty good chance there's a third.
def recency_star_rating(number, df, col, title):
    """
    Breaks data into sections based on the most recent order
    """
    df = df[df[col] != "nan"]
    df = df[df[col] != "Missing Order Data"]
    df = df.sort_values(by=col, ascending=True)
    df[title] = pd.qcut(df[col],number,labels=False)
    df[title] = df[title] + 1

    return df

rfm_report = recency_star_rating(5,rfm_report,"lastOrderDate","Recency Rating")
The purpose of this function is to assign a rating 1-5 for people's lastOrderDate. The top 20% who purchase closest to today receive a 5 and the lowest 20% who purchases are the oldest receive a 1. This is where the clean data became very necessary. It is often recommended to just delete the rows that have null values but in my use case where one column was null another wasn't. Each time I ran the function I had to pull out the non-null rows. I almost feel like an expert in boolean indexing after writing this program. I then had to sort the values from smallest to largest so I can segment the list. I learned a completely new tool in Pandas for this pandas.qcut. The function takes in a series, the number of segments, and then returns the data broken evenly into those segments. I only halfway know the function because it returns fields in the category data type. I finished the whole program in the time would have taken me to learn about categorical data. Easy way out was to convert the column back to a string. I originally attempted to create my own function for this based on df.iloc[] but I couldn't get it to work and finally when I ran it pass my mentor he sent me the link to pd.qcut. While clearly frustrated, I learned another valuable lesson.
Lesson 2: There's a pre-built function for that. Before reinventing the wheel, do a quick google search to see if there's a function that accomplishes what you need. Chances are there is and chances are even higher that it does way more than you could build on your own.
def monetary_star_rating(number, df, col, title):
    """
    Breaks data into sections based on the amount of money spent
    """
    df_1 = df.loc[df['ordersCount'] == 1]
    df_1[title] = 1

    df_2 = df[df['ordersCount'] != 1].sort_values(by=col, ascending=False)
    df_2[title] = pd.qcut(df[col],number,labels=[2,3,4,5])

    frames = [df_1, df_2]
    df = pd.concat(frames)
    return df

rfm_report = monetary_star_rating(4,rfm_report,"totalAmountOfOrders","Monetary Rating")
This function takes the totalAmountOfOrders which is the total monetary value of all the orders for a specific customer and assigns a rating. This particular rating is not as cut and dry as the Recency. For this dataset, 62% of customers only purchased once with an average lifetime value of $48, whereas the top 1% purchased 15+ times with an average lifetime value of $652. There's no possible way to evenly distribute that amoung 5 equal sections. Considering that one time buyers are low value across the board, a compromise is to take them out and assign a 1 then segment the other rows. You'll notice something different in the use of pd.qcut here. I added the attribute "labels". For some reason in the previous function when I added labels the dtype was category and in this function, it returned int64 dtype.
Lesson 3: Don't use functions that you don't understand even if they work. When the code begins to act in ways you didn't intend, you'll have no clue what to do to fix it. This will lead to code rot because you'll most likely leave it alone, afraid that changing it will break the whole system.

"""
def specific_frequency_star_rating(x):

    #Breaks data into sections based on the amount of orders

    #df = df[df[col] != "nan"]
    #df = df[df[col] != "Missing Order Data"]
    if x <= 8:
        rating = 1
    elif (9 <= x) & (x <= 25):
        rating = 2
    elif (26 <= x) & (x <= 42):
        rating = 3
    elif (43 <= x) & (x <= 59):
        rating = 4
    elif (60 <= x):
        rating = 5
    return rating

"""
def create_cut(number, df, col):
    """
    First finds all the unique fields then segments them in quintiles.
    Uses the quintiles to give ratings to the original data
    """

    sorted_col = df[col].sort_values()
    unique_val = sorted_col.unique()
    unique_val = unique_val[unique_val != 1]
    unique_cut = pd.qcut(unique_val,number,labels=False)
    unique_dict = {"Items" : unique_val, "Labels" : unique_cut}
    unique_df = pd.DataFrame(unique_dict)

    left_min = list()
    right_max = list()

    for i in range(4):
        testmin = unique_df[unique_df.Labels == i]
        testmin = testmin["Items"]
        testmin = min(testmin)
        int(testmin)
        left_min.append(testmin)
    for i in range(4):
        testmax = unique_df[unique_df.Labels == i]
        testmax = testmax["Items"]
        testmax = max(testmax)
        int(testmax)
        right_max.append(testmax)

    bins = pd.IntervalIndex.from_arrays(left_min,right_max,closed="both")
    cut = pd.cut(df["ordersCount"],bins)

    return cut


def create_freq_labels(df, col):
    test = df[col].unique().sort_values()
    test = test.astype(str)
    test = test.tolist()
    test.remove('nan')
    print(test)
    column = df[col].astype(str)
    num = 2
    test_dict = dict()
    for i in test:
        test_dict[i] = num
        num += 1
    print(test_dict)
    column = column.replace(test_dict)
    column = column.replace({'nan':1})

    return column
rfm_report["Frequency Rating"] = create_cut(4, rfm_report,"ordersCount")
rfm_report["Frequency Rating"] = create_freq_labels(rfm_report,"Frequency Rating")
All I can say here is that programming is hard. Frequency Rating segments the customers by the number of orders. Observe the commented out function specific_frequency_star_rating and you'll see that this task is quite easy to accomplish when you already know the range of orders. Take away that certainty and this ant hill becomes a mountain. I truly spent a week just on this part. My golden hammer pd.qcut rejected me with endless errors. The silver hammer pd.cut only got me halfway there because of a known issue. Goes to show, even the experts aren't immune to bugs. I'm sure there was a better way of doing this but I finally got it working. Explaining it would take another essay. Just know that it took all my knowledge of dictionaries, indexing, lists, and data type conversions to make this sucker work.
Two lessons here:
4. Don't rely too heavily on a particular function. It won't address all use cases and besides no one wants to be a one trick pony.
5. As I said earlier, programming is hard. This may have seemed like an easy problem for others but this was the hardest thing I've done in my short coding career. After solving it, I am pumped and ready to move on to the next step. Coding is hard but succeeding has to be one of the more satisfying things in my life.
Where do I go from here?
All this effort went into just recreating the report as is and I mentioned before that most of the presented data was useless. I'd like to pull in the raw transactional data instead of the aggregated data and see if I can find some true insights there. This will pose its own set of issues such as merging multiple NoSQL databases that spit out JSON files and have millions of rows of data as well as learning how to work in the AWS cloud. It'll all be worth it when I'm able to say "Your top customers purchase product x the most on Wednesdays and respond to 10% off coupons codes which result in an increased average order value of x %". Now that will be some real value creation. There are other levels to this such as useful visualizations and maybe a machine learning aspect that begins to predict what customers will purchase what product and when. So much to learn but I'm limiting the scope of this version so that I can actually have a finished project.
- Phase One - Recreate all current calculations as functions and find other valuable metrics.
- Phase Two - Connect to the raw data and write the processing into the program so that I have much more data to work with.
- Phase Three - Figure out how to visualize in a digestible format and how to serve up explanations of the data.
- Phase Four - Package it all up and connect it an interactive front end where the user can explore the data.
The End.
Thank you kindly for indulging my first blog post about my first project. More to come.

Latest comments (2)
Based upon the project outline, you can try this tutorial series by Sentdex for data analysis and his Dash tutorial to visualise the data.
Thanks!! I'll definitely look into those