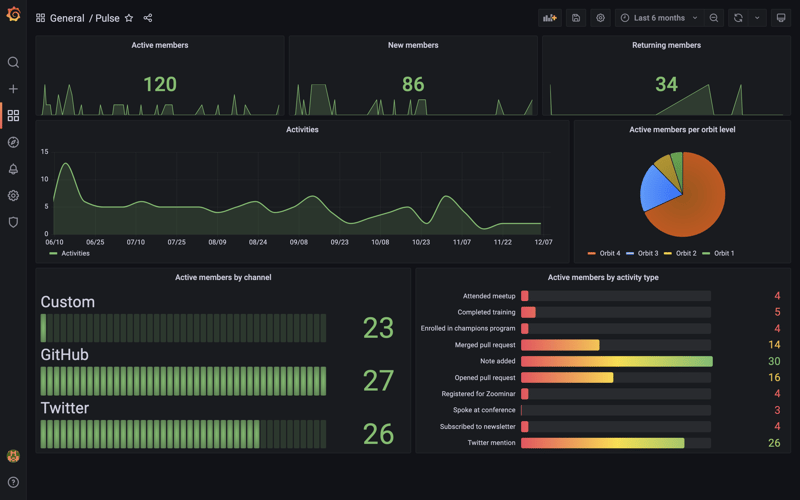
In a previous post I wrote how my colleague Daniel Gonzales Lopes and I worked out how to get GitHub send data to Orbit, even though Orbit can't send data to two different workspaces.
We got that to work, only to find my next pet peeve: Orbit's reports are pretty rudimentary. And I dreamed of being able to view community data with other health metrics for my product, combined in one graph.
I tagged Marcus Olsson, hoping he'd be interested in scratching that itch. Marcus is a Developer Advocate at Grafana Labs, focused on their plugin ecosystem.
Turns out Marcus was listening closely. AND the second (official) Grafana internal Hackathon was about to kick off. We teamed up, and because Orbit's CTO and Co-founder Josh Dzielak commented on the original article hinting things to come in 2022 on this front, we asked him if we could have a call.
We jumped on a call, the 3 of us, to figure out how we can get timeseries data out of Orbit, and into Grafana. The goal, to plot sentiment against performance. Correlate community activity against... well, really any metrics. And to be able to (in time) annotate spikes (launches, acquisitions, event engagement).
For every report in the Orbit application there's the option to "view JSON". In the view_params bit of that JSON file you can review the visualization type (bar, line, or table).
You can also try some URL manipulation by changing the time period for instance: relative=this_6_weeks.
If you're a Grafana user, chances are that you're using one or multiple plugins to extend Grafana. Plugins have been supported since Grafana 3.0. With over 150 published plugins, it's safe to say the platform is mature.
The plugin
In Grafana, add the Orbit data source. Enter your Orbit workspace path, and get your API token from Orbit. Select something like 'last 60 days' to see something useful. Toggle between members / activities.

A sneak peek, using test data.
The plugin is essentially a wrapper over the URL. Marcus mimicked what Orbit does in terms of reports, and added some UI elements on top of that. The plugin is feature complete for now*.
This all was done using a beta-edition of the Orbit API that isn't really documented yet (but should be shortly, or so we were told).
The cumulative view can take some time to load. Still, Grafana is snappier than Orbit when it comes to serving graphs today.
Marcus recorded a quick tutorial on configuring the data source in Grafana.
Next steps
You could consider configuring alerting for your instance - so you can get notified when for instance there's a lot of activity in a certain area.
Head over to the repository to add your suggestions for the plugin.
*Orbit is working on a couple of things, including more structured connections between members and organizations, and cities and countries, and we'll update the plugin as those are available. Tags and activity types are bound to get more expressive as well.


Oldest comments (5)
The repository link doesn't work, I get a 404. Is that expected?
Should work, Coen, could you try again?
Oh wow! This looks wonderful and definitely has me excited for the future and all whats to come!
Thanks for sharing!
Love this project, really fun working with you and Marcus!
If any readers want to try out the beta API this project is built on, hit me up and I'll be happy to show you around 🙏🏻