The State of Monitoring
Monitoring is about catching unexpected changes in application behavior. Traditional monitoring tools achieve this through alert rules and spotting outliers in dashboards. While this traditional approach can typically catch failure modes with obvious service impacting symptoms, it has two limitations:
- There is a long tail of problems that are not service impacting in the aggregate, but impact some aspect of the user experience (e.g. software bugs that give a user an unexpected error, or incorrect results). Traditional (black box) monitoring approaches do not attempt to catch all of these due to the complexity of the task (setting up and maintaining rules for each unique problem).
- The root cause is not identified -- many failure modes have similar symptoms, so it takes time consuming investigation to identify the root cause. And shrinking time to resolution is one of the biggest challenges of managing a modern service -- high Mean-Time-To-resolution (MTTR) hurts both customer loyalty and team productivity.
 In either case, the burden is on the human -- to spot outliers in dashboards, drill down progressively, and inevitably - know what to search for in logs.
However, this doesn't scale as application complexity grows and failure modes multiply. There are simply too many unknown failure modes, too much data to scan, and too many variants of log messages to search for. Some new entrants to the space focus on improving the speed, cost or scalability of search. While welcome, this does nothing to address the bottleneck -- which is the human brain's ability to know what to search for in a given situation.
Machine Learning and Anomaly Detection To the Rescue -- Sort Of
Many tools have started to offer add-on machine learning features to augment human effort. While a welcome addition, it still leaves too much work for the human. Users are required to choose specific time series to track, choose the right anomaly detection technique for each one, and then be presented with visualizations of outliers to further analyze. This can be useful in  scenarios where a user knows exactly what types of deviations they want to analyze (and for which metrics). But it is not useful for catching the wide range of unknown unknowns that might impact the application. And traditional tools only offer this toolset for time series data (e.g. metrics) -- it is rare to see a meaningful anomaly detection solution for logs, let alone the ability to correlate log and metric anomalies. This makes these tools blind to the root cause of any issue, and requires further time consuming drill down such as log searches.
The Evolution of Machine Learning -- Autonomous Incident Recognition
By contrast, Zebrium built machine learning (ML) based anomaly detection as the foundation, so took a very different approach. Our software automatically detects anomalies in ALL log events, and ALL metrics. We do all the work for the user -- no need to handpick which log events or metrics to track via anomaly detection, nor algorithms, corrections and other controls. We automatically apply the best technique for each type of data and adapt the behavior as the application changes.

But this is not the special part. What's unique about this approach is that it automatically  identifies correlated patterns of anomalies that define service incidents. It doesn't just show pretty charts and make the user figure out how this might correlate to other issues in the application. Instead it automatically groups together all related log and metric anomalies, identifies the possible root cause, the hotspots (nodes, container/log types etc.), and creates a fully defined incident summary for the user. You can see some real life examples here.
This has two huge benefits:
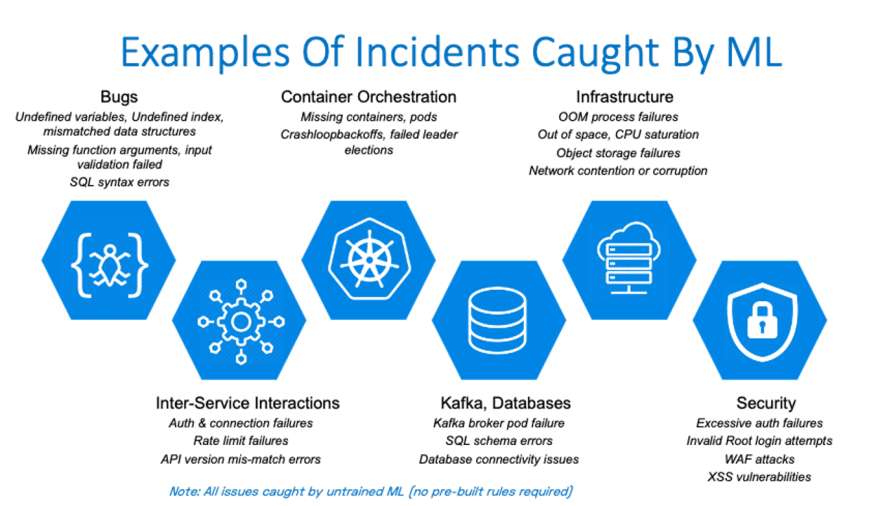
It is capable of detecting the long tail of incidents that don't necessarily trigger the symptom alerts at an aggregate service level. This includes issues such as software bugs, latent infrastructure degradation, problems in inter-service interaction, database issues, container orchestration issues and even security issues.

It doesn't just detect an incident - by automatically creating a summary of all the anomalous events and metrics patterns surrounding the incident, it slashes time to root cause and resolution. And it does this not by correlating meta-data, notes or tags from a library of previously known incidents, rather it detects brand new incidents with high signal to noise. This includes all the unknown unknowns that crop up regularly in a modern cloud native application, without peppering them with lots of useless false positives.
This is why we believe Autonomous Monitoring, which includes autonomous Incident Recognition is the future of monitoring. You can try it for yourself. Getting started is free and takes less than two minutes.
Posted with permission of the author Ajay Singh.

Top comments (0)