Update 02/03/2020 - the documentation error has since been fixed, and Microsoft has reached out to me for a full refund.Every engineer I’ve talked to from Microsoft has been nothing but wonderful, but the official support channels are still slow (we’re talking weeks).I’m satisfied with the conclusion to this, even though I still maintain that the API choice is pretty questionable
Or the alternative title, “How Microsoft shot me in one foot, and then gave me a gun so I could shoot my other one”
Custom Filtering - or the time Microsoft shot me in the foot
Azure Application Insights is an Azureservice to help you monitor your applications. It collects log, http requests, exceptions - you name it.It then allows you to view this data in numerous ways, some of them rather clever.
To do this, it C# collects a lot of data. Every log statement, outgoing and ingoing http call, every burp and sneeze.Application Insights is (primarily) priced per GB of data ingested - and it’s pretty expensive.Some of their competitors charge much less. Humio charges approximately 0.9$ per gb of ingested data, and Datadog charges0.1$. Application Insights charges a whopping 2.76$ per ingested Gigabyte. And Application Insights can collect a lot of gigabytes.
With prices this expensive, you’ll probably only want to collect the data you’re actually interested in.In our case, we’re using Azure Event Hubs, and the Azure SDK for that is very chatty with it’s http requests, particularly whenprocessing hundreds of messages every second.
Application Insights doesn’t make excluding data to send easy, but it does make it possible.In the Application Insights C# SDK, you can write what’s called a Telemetry Processor,which can process, or discard telemetry before it’s sent to the server.
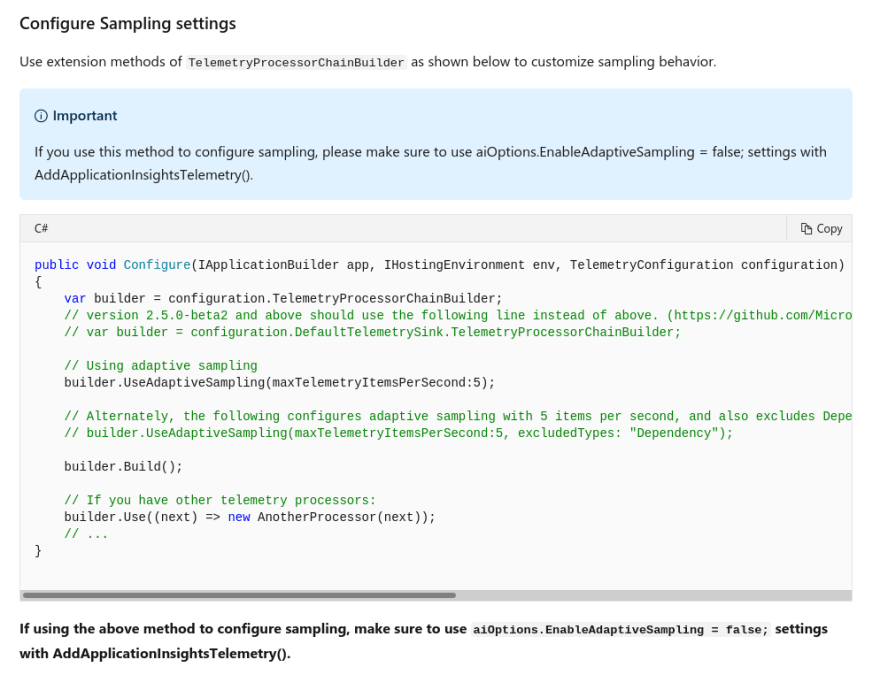
You can configure Application Insights with your custom processor like this example from the official docs:
public void Configure(IApplicationBuilder app, IHostingEnvironment env, TelemetryConfiguration configuration)
{
    var builder = configuration.TelemetryProcessorChainBuilder;

    // Using adaptive sampling
    builder.UseAdaptiveSampling(maxTelemetryItemsPerSecond:5);

    builder.Build();

    // If you have other telemetry processors:
    builder.Use((next) => new AnotherProcessor(next));
    // ...
}
Notice the last line. So I went right ahead and implemented a telemetry processor that blocked the torrent of data,and hooked it up like the example here demonstrated.
This is where Microsoft shot me in the foot. The example there, is flat out wrong. The builder.Use() statement doesnothing, if called after the .Build() statement. I did think the order seemed odd, but the whole APIis a little strange so I figured this was just another quirk.
Turns out, it wasn’t, and following the documentation exactly, lead to us sending a torrent of expensive data to application insights.It’s not all bad yet though! Application Insights knows it can generates a boatload of data. To prevent that, it has a featurecalled Adaptive Sampling
Adaptive Sampling - or the gun Microsoft gave me
Adaptive Sampling attempts to take a representative sample of your data, and then only send that to the AI server.So if you have identical logs, or http requests, Adaptive Sampling tries to only send a representative sample of that.
Seemingly a good idea considering the price, but if you’re trying to trace a request among multiple services,having some of the logs thrown away is impossible to work with.
So naturally, I wanted to disable this for logs, (or traces as they’re called in Application Insights).Now here’s another questionable API decision. The way you configure adaptive sampling in .NET Core is:
- You turn it off at the start of your program
- Later on, you turn it on again, with some of the new configuration
 Have you tried turning your Adaptive Sampling on and off again?
So this is what I did:
        public void Configure(IApplicationBuilder app, IWebHostEnvironment env,
            IOptionsMonitor<TelemetryConfiguration> telemetryConfiguration)
        {
            TelemetryProcessorChainBuilder
                builder = telemetryConfiguration.CurrentValue.DefaultTelemetrySink.TelemetryProcessorChainBuilder;
            builder.UseAdaptiveSampling(
                excludedTypes: "Trace"
            );
            builder.Build();
        }
Can you spot the difference? I certainly thought I was doing 1:1 what the documentation said for a long time.
ASP.NET Core heavily uses the Options pattern,which is how to inject configuration into your classes. You inject an IOptionsMonitor<YourClass>, and though that you get the configuration classes.So that’s what I did, and it seemed to work fine. I got, seemingly, a fully functional TelemetryConfiguration. However, when updating thisparticular instance of the TelemetryConfiguration, nothing actually changed - as it was completely decoupled from the rest ofthe Application Insights infrastructure.
That’s the gun Microsoft handed me. That to configure the adaptive sampling, I had to turn it off and on again - and thatyou can turn it on wrong!
I’ll admit it, I shot myself in the foot, not following the documentation to the letter, but I maintain that when configuringa feature with a potentially huge cost impact, “turn it off and hope you manage to turn it on right afterwards”, is really shoddy API design.
Now, thank God, Application Insights does have a pre-configured limit of 100GB a day, which means by default it won’t ingestmore daily data than that.This was some relief from the perfect storm of my TelemetryProcessor not working due to Microsoft’s documentation,and the adaptive sampling being turned off, due to my own inability to follow instructions.It meant that we could be billed at the most ~300$ a day (which to be honest, is also a little obscene for logging).
Unfortunately, we don’t look at our cost statements every day, and we deployed this right before Christmas…


Top comments (1)
We filtered out all successful "GET" requests (which only took less than couple of milliseconds to finish) for images/javascripts/css. This reduced telemetry size down to 90%.
This reduced the size of data and gave us way to look at only requests with problems, failing or requests taking too long to finish.