================================================================
= Welcome to the Amazon CloudWatch Agent Configuration Manager =
=                                                              =
= CloudWatch Agent allows you to collect metrics and logs from =
= your host and send them to CloudWatch. Additional CloudWatch =
= charges may apply.                                           =
================================================================
On which OS are you planning to use the agent?
1. linux
2. windows
3. darwin
default choice: [1]:

Trying to fetch the default region based on ec2 metadata...
Are you using EC2 or On-Premises hosts?
1. EC2
2. On-Premises
default choice: [1]:

Which user are you planning to run the agent?
1. root
2. cwagent
3. others
default choice: [1]:

Do you want to turn on StatsD daemon?
1. yes
2. no
default choice: [1]:

Which port do you want StatsD daemon to listen to?
default choice: [8125]

What is the collect interval for StatsD daemon?
1. 10s
2. 30s
3. 60s
default choice: [1]:

What is the aggregation interval for metrics collected by StatsD daemon?
1. Do not aggregate
2. 10s
3. 30s
4. 60s
default choice: [4]:

Do you want to monitor metrics from CollectD? WARNING: CollectD must be installed or the Agent will fail to start
1. yes
2. no
default choice: [1]:

Do you want to monitor any host metrics? e.g. CPU, memory, etc.
1. yes
2. no
default choice: [1]:

Do you want to monitor cpu metrics per core?
1. yes
2. no
default choice: [1]:

Do you want to add ec2 dimensions (ImageId, InstanceId, InstanceType, AutoScalingGroupName) into all of your metrics if the info is available?
1. yes
2. no
default choice: [1]:

Do you want to aggregate ec2 dimensions (InstanceId)?
1. yes
2. no
default choice: [1]:

Would you like to collect your metrics at high resolution (sub-minute resolution)? This enables sub-minute resolution for all metrics, but you can customize for specific metrics in the output json file.
1. 1s
2. 10s
3. 30s
4. 60s
default choice: [4]:

Which default metrics config do you want?
1. Basic
2. Standard
3. Advanced
4. None
default choice: [1]:
2
Current config as follows:
{
    "agent": {
        "metrics_collection_interval": 60,
        "run_as_user": "root"
    },
    "metrics": {
        "aggregation_dimensions": [
            [
                "InstanceId"
            ]
        ],
        "append_dimensions": {
            "AutoScalingGroupName": "${aws:AutoScalingGroupName}",
            "ImageId": "${aws:ImageId}",
            "InstanceId": "${aws:InstanceId}",
            "InstanceType": "${aws:InstanceType}"
        },
        "metrics_collected": {
            "collectd": {
                "metrics_aggregation_interval": 60
            },
            "cpu": {
                "measurement": [
                    "cpu_usage_idle",
                    "cpu_usage_iowait",
                    "cpu_usage_user",
                    "cpu_usage_system"
                ],
                "metrics_collection_interval": 60,
                "resources": [
                    "*"
                ],
                "totalcpu": false
            },
            "disk": {
                "measurement": [
                    "used_percent",
                    "inodes_free"
                ],
                "metrics_collection_interval": 60,
                "resources": [
                    "*"
                ]
            },
            "diskio": {
                "measurement": [
                    "io_time"
                ],
                "metrics_collection_interval": 60,
                "resources": [
                    "*"
                ]
            },
            "mem": {
                "measurement": [
                    "mem_used_percent"
                ],
                "metrics_collection_interval": 60
            },
            "statsd": {
                "metrics_aggregation_interval": 60,
                "metrics_collection_interval": 10,
                "service_address": ":8125"
            },
            "swap": {
                "measurement": [
                    "swap_used_percent"
                ],
                "metrics_collection_interval": 60
            }
        }
    }
}
Are you satisfied with the above config? Note: it can be manually customized after the wizard completes to add additional items.
1. yes
2. no
default choice: [1]:

Do you have any existing CloudWatch Log Agent (http://docs.aws.amazon.com/AmazonCloudWatch/latest/logs/AgentReference.html) configuration file to import for migration?
1. yes
2. no
default choice: [2]:

Do you want to monitor any log files?
1. yes
2. no
default choice: [1]:
2
Saved config file to /opt/aws/amazon-cloudwatch-agent/bin/config.json successfully.
Current config as follows:
{
    "agent": {
        "metrics_collection_interval": 60,
        "run_as_user": "root"
    },
    "metrics": {
        "aggregation_dimensions": [
            [
                "InstanceId"
            ]
        ],
        "append_dimensions": {
            "AutoScalingGroupName": "${aws:AutoScalingGroupName}",
            "ImageId": "${aws:ImageId}",
            "InstanceId": "${aws:InstanceId}",
            "InstanceType": "${aws:InstanceType}"
        },
        "metrics_collected": {
            "collectd": {
                "metrics_aggregation_interval": 60
            },
            "cpu": {
                "measurement": [
                    "cpu_usage_idle",
                    "cpu_usage_iowait",
                    "cpu_usage_user",
                    "cpu_usage_system"
                ],
                "metrics_collection_interval": 60,
                "resources": [
                    "*"
                ],
                "totalcpu": false
            },
            "disk": {
                "measurement": [
                    "used_percent",
                    "inodes_free"
                ],
                "metrics_collection_interval": 60,
                "resources": [
                    "*"
                ]
            },
            "diskio": {
                "measurement": [
                    "io_time"
                ],
                "metrics_collection_interval": 60,
                "resources": [
                    "*"
                ]
            },
            "mem": {
                "measurement": [
                    "mem_used_percent"
                ],
                "metrics_collection_interval": 60
            },
            "statsd": {
                "metrics_aggregation_interval": 60,
                "metrics_collection_interval": 10,
                "service_address": ":8125"
            },
            "swap": {
                "measurement": [
                    "swap_used_percent"
                ],
                "metrics_collection_interval": 60
            }
        }
    }
}
Please check the above content of the config.
The config file is also located at /opt/aws/amazon-cloudwatch-agent/bin/config.json.
Edit it manually if needed.
Do you want to store the config in the SSM parameter store?
1. yes
2. no
default choice: [1]:

What parameter store name do you want to use to store your config? (Use 'AmazonCloudWatch-' prefix if you use our managed AWS policy)
default choice: [AmazonCloudWatch-linux]

Trying to fetch the default region based on ec2 metadata...
Which region do you want to store the config in the parameter store?
default choice: [us-east-1]

Which AWS credential should be used to send json config to parameter store?
1. 12312312321312312(From SDK)
2. Other
default choice: [1]:

Successfully put config to parameter store AmazonCloudWatch-linux.
Program exits now.
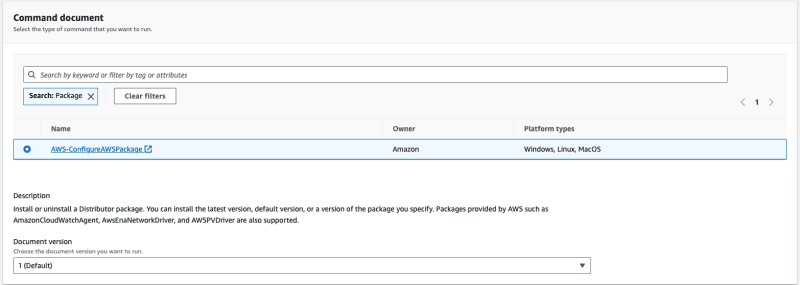
Restart Cloud Watch Agent from SSM
Then click Run, and wait to success
Go To Cloud Watch dashboard verify
Top comments (0)
Subscribe
For further actions, you may consider blocking this person and/or reporting abuse
We're a place where coders share, stay up-to-date and grow their careers.


Top comments (0)