When attempting to make predictions using multiple linear regression, there are a few steps one must take before diving in, particularly, prepping continuous and categorical variables accordingly. Through this blog post, I will be showing you some techniques to make your data valid and usable in multiple linear regression.
Continuous Variables
What They Are
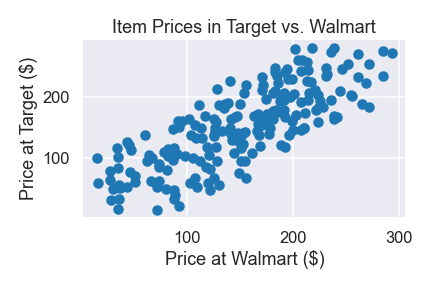
Continuous variables measure things like height, time, or other things that would not make sense to be classified into specific categories. One way to identify potential continuous variables is to look at the scatter plot of the data points. Usually, the data will be distributed in a cloud-like shape, unlike that of a categorical variable, which will be shown later.
How to prep them
Continuous variables are a lot easier to deal with than categorical variables because adjustments are not always needed (besides the initial data cleaning). However, there are some changes, such as normalization and log transforming, that may potentially improve the model.
Standardization
This method is pretty self-explanatory as you would standardize each data point. In other words, for each data point, you would subtract the mean and divide by the standard deviation.
# function to standardize values
def standardize(col):
    return (col - col.mean()) / col.std()
Log Transform
This method takes the previous standardization method and takes it one step forward. Before the standardization is done, you would first take the logs of each variable, which will make your data more normally-distributed. Afterwards, standardize each data point.
# Code excerpt where 'cont_df' is assumed to be instantiated
cont_log_df = np.log(cont_df)
cont_log_std_df = cont_log_df.apply(standardize)
Categorical Variables
What They Are
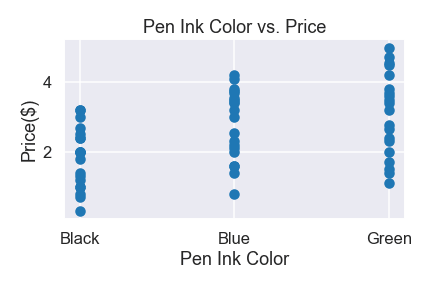
Categorical variables, as the name suggests, represent things that can be divided into groups or categories. For example, color or grade level could be considered categorical. One way to identify potential categorical variables is to look at the scatter plot of the data points. Usually, the data will be distributed in a rod-like shapes, unlike the clouds of continuous variables.
How to Prep Them
One-Hot Encoding
This is required when running categorical variables into linear regression. The idea is to create dummy variables that each represent a group. For example, if you had a variable of cities in California, you would need one dummy for each unique city in that column. Afterwards, if a certain data point is associated with that city, you would place a 1 there, if not, 0. One thing to keep note of is the dummy variable trap. Because of how dummy variables are created, you could technically "predict" a dummy from by combining all the other ones (multicollinearity), which will be an issue for multiple linear regression. To combat this, drop the first column, which will eliminate the perfect multicollinearity.
city = ['LA', 'SD', 'SAC', 'SD','LA', 'SAC', 'SD', 'LA']

# convert into series
city_series = pd.Series(city)

# convert into categories
city_cat = city_series.astype('category')

# get dummy variables
# remember to drop first column
pd.get_dummies(city_cat, drop_first=True)
Binning
Binning is a technique to cut down on the number of categorical variables. Ideally, categorical dummy variables should be kept at a minimum and if possible, you should have less dummies than continuous variables. The idea behind it is creating new categorical variables based on a criteria that you choose. An example would be converting months into seasons (which cuts 12 dummies down to 4 dummies).
# This is a change unique to months and seasons. This
# method forms bins with pandas.cut(), which cuts a list
# of consecutive numbers at the given points. In order for
# winter to be represented by Dec-Feb (12, 1, 2), we need
# a way for 12 to smoothly connect to 1, that is, convert
# all 12's into 0's.
bin_df.loc[bin_df['month'] == 12, 'month'] = 0

# The cuts are made left-exclusive and right-inclusive.
# Eg. The first bin does not include -1, but includes 2.
month_bins = [-1, 2, 5, 8, 11]

# Apply bin labels
season_bins = pd.cut(bin_df['month'], month_bins, labels=
['Winter', 'Spring', 'Summer', 'Fall'])
Summary
Now to summarize, continuous variables can be standardized or log transformed. These steps may help the model, but are not required. In fact, if they do not help the fit of the model, using these techniques are not recommended. Categorical variables require some sort of adjustment to be able to run a multiple linear regression. These can be one-hot encoding dummy variables or further lessening the number of categorical dummies by binning.
Thank You
Hopefully this rundown on some of the common steps to take when preparing data for multiple linear regression has been helpful. Thank you for reading!

Top comments (0)