This post will walk you through some of the different classification models available to use in scikit-learn.
First, it's important to go over what a classification algorithm is and how they are used. A classification algorithm takes in a training set of data to create a model that will predict and classify other data into pre-determined categories. For example, a phone company may take in customer data pertaining to sales, location, etc. to determine whether certain customers are likely to stick with the company for the next calendar year.
K-Nearest Neighbors
What it Does
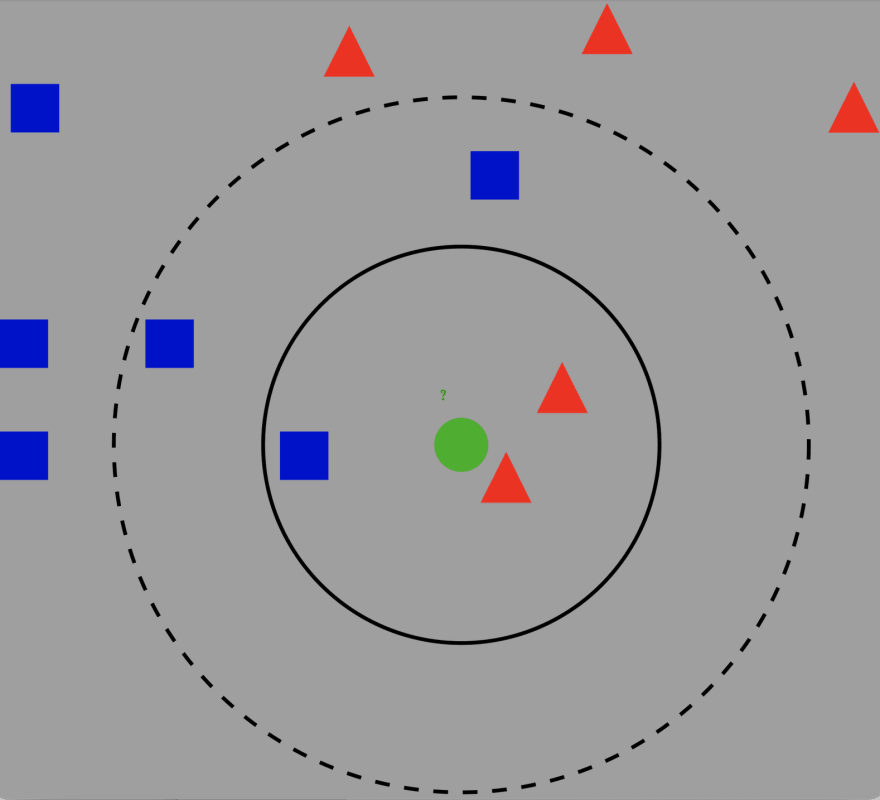
K-Nearest Neighbors is a classification algorithm that measures distances between points. KNN takes a point and measures the k nearest points in the training set. Then, it looks at the labels of each point and classifies the starting point by the majority of the labels surrounding it. Look at the example below:

Here, the green point is our starting point and we see the surrounding blue and red points. If k = 3, we see the three nearest points are two reds and one blue. Thus, the algorithm will classify the green point as a red triangle.
Code
# Import KNeighborsClassifier
from sklearn.neighbors import KNeighborsClassifier

# Instantiate KNeighborsClassifier
knn = KNeighborsClassifier()

# Fit the classifier
classifier = knn.fit(scaled_data_train, y_train)

# Predict on the test set
test_preds = classifier.predict(scaled_data_test)
Decision Trees
What it Does
A decision tree, quite simply, takes a starting point and makes multiple decisions that branch out to ultimately make a classification. See the example below:

This particular example tries to determine what kind of contact lens a person should wear depending on different characteristics. These trees use a greedy search, which always chooses the best way to classify the training data at each classification (depending on the criteria: entropy, information gain, etc).
Code
from sklearn.tree import DecisionTreeClassifier
clf = DecisionTreeClassifier(criterion='entropy')
clf.fit(X_train_ohe, y_train)
Random Forest
What it Does
A random forest classifier is quite simply multiple decision trees. Usually, bootstrapping is involved where subsets of the training data are created with replacement. This way, each time you create a decision tree, it'll be different from the last. Each tree will classify a point and the random forest will take the aggregate majority as its final prediction. While this is better than a singular decision tree as it has a less likelihood of overfitting, it does take more memory and is more computationally complex.
Code
from sklearn.ensemble import RandomForestClassifier

# n_estimators is how many trees in the forest
forest = RandomForestClassifier(n_estimators=100)
forest.fit(data_train, target_train)
How to Evaluate a Model
Code
print(confusion_matrix(y_test, pred))
print(classification_report(y_test, pred))
print("Testing Accuracy for Decision Tree Classifier: {:.4}%".format(accuracy_score(y_test, pred) * 100))
What These Mean
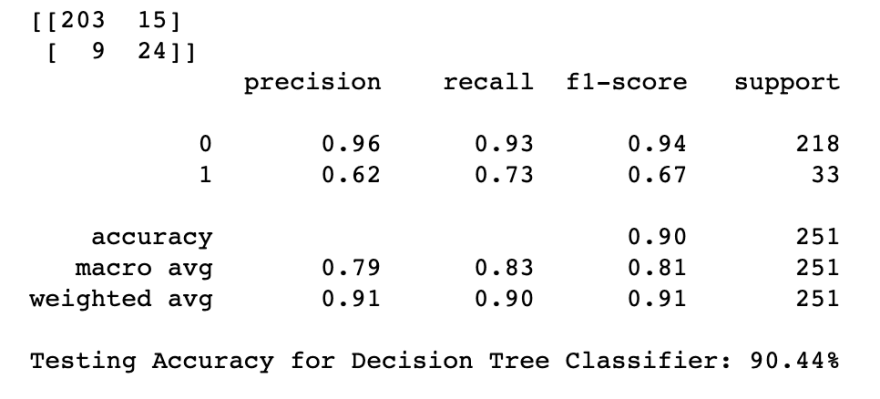
The code above will give you something like this:

Let's go over how to read this. At the top, we see a 2x2 confusion matrix. Going from left-right, top-bottom, these numbers represent True negatives, False positives, False negatives, and True positives. The other metrics measure the following: Accuracy measures the proportion of correct classifications, precision measures the proportion of predicted positives that are actually positive, recall measures how many of the actual positives were correctly classified, and f1-score measures the balance between precision and recall. These are all metrics that can be used to determine how good your classification model is.


Top comments (0)