I'll show you how to use standard deviation to attempt to predict price reversals. As a bonus, we'll measure volatility ranges to place orders at optimal distances from the mean price.
Signals
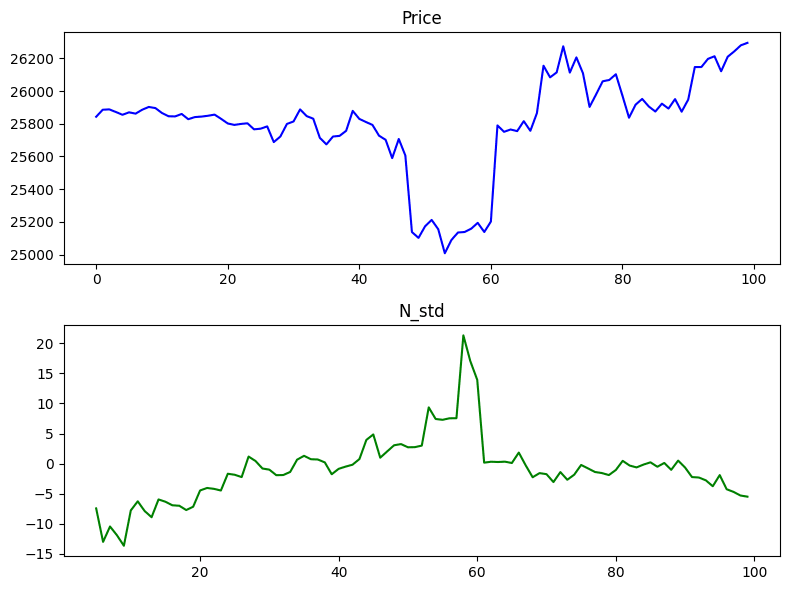
We'll try to predict price reversals from peak values to the mean using standard deviation. The idea is that the market often returns to mean values after "overheating." These peak values correspond to peak standard deviation values.
Of course, this alone isn't enough to reliably predict price direction. So, we'll use two filters.
- First, the standard deviation must decrease to avoid shorting during continued growth and buying during declines.
- Second, the current price must be below the mean for buying and above it for selling.
Volatility Levels
We need to know the current market volatility to adjust our targets, stops, and more.
Typically, volatile periods form clusters. New information enters the market, traders use it, there's a price discovery process, and then the market calms down again.
We'll take data from several days and calculate boundaries for five standard deviation levels. Then, we'll plot a chart to see the results.
This is similar to the work I recently shared. However, in that case, I worked with tick data, and this time, I used candlesticks. Link to previous work
You can access the complete code here.

Top comments (0)