
So you’ve figured out how to run serverless code in AWS. Now what? Give your Lambda function superpowers with AWS Powertools for logging, metrics, and more
When you first figure out how AWS Lambda works for the first time, it’s a complete game changer. You mean I can concentrate on the bit that matters — the business logic of my code — and forget about all that banal stuff around servers? Operating systems? Patching? Image management? Auto-scaling groups? Retiring AMIs?
Well, yes! That’s the initial power of serverless with AWS Lambda.
It’s a selling point so strong — that resonates so well with developers — that the team I look after at work is almost exclusively building with serverless these days.
But after you’ve picked your teeth out of your underpants from the sheer awe of how awesome Lambda is, you begin to realise that there’s also a rich ecosystem of libraries, tools, and packages that help make your Lambda development experience even more powerful. Perhaps none more so than Lambda Powertools.
Available for .NET, Java, Typescript, and Python from https://github.com/aws-powertools/, Powertools are designed to give AWS developers a leg up in their building by offering a suite of utilities that put best practice patterns at your fingertips for the following areas of Lambda development:
Logging: Gives you a fantastic structured JSON logger that includes handling Lambda events for you (cold starts, etc.)
Metrics: Provides a means to easily collect custom metrics from your application for storage and retrieval via AWS CloudWatch.
Tracing: One of the most powerful companion services to AWS Lambda is X-ray. Powertools tracing allows you to easily hook into X-ray, providing a means to send traces from functions to your X-ray service simply and easily.
Plus two new(er) features included in the Powertools bundle are Parameters, which provide a simple way to work with parameter values stored in SSM, Secrets Manager, or DynamoDb, and Idempotency, which helps developers build functions that produce the same results when rerun to allow safe retries.
You can find out much more detail in the Powertools GitHub, but for now, I’m going to give you a personal tour — and beginners guide — to using two of the main features of Powertools: Logging and Metrics. So grab your serverless armour, turn on provisioned concurrency, and let’s learn how to utilise Lambda Powertools!
(Sidenote: All my examples will be in .NET because it’s awesome, but the concepts will apply for the most part to other supported runtimes.)
Logging

It’s really (really) hard to find an image that represents logging. I did find some, but they were logging — like, with an axe | istockphoto
Logging is a critical part of observability in your applications, and the quality of your logged content can make — or break — your ability to get useful information and diagnostics about how your application is performing. I spent a fair bit of time getting logging right, particularly with applications that span multiple Lambda functions, so anything that can help make that process simpler or better is immediately something I’m interested in.
A quick check of the source for the Logging sample code shows me the crux of getting started. First up, there’s a new package to be added to your code:
using AWS.Lambda.Powertools.Logging;
Next, it appears that there’s a new logging annotation that can be added to the top of your handler entry point.

First up, I’m loving the continued use of annotation style functionality in .NET and Lambda. (Another great example is the annotations framework for Lambda and .NET. If you haven’t checked it out yet — make sure you do!) Adding this LogEvent annotation automatically logs your incoming event as JSON in CloudWatch (in this case, it would be the APIGatewayProxyRequest object).
This makes me so, so very happy. Why? Because it’s almost a basic standard in our team to ensure that we record the incoming event in our logs for a given Lambda function. Understanding what data looks like when it gets into your function handler is critical. While you can get some of this information from the API Gateway execution logs if you’re using API Gateway, it can often be truncated.
Now we can annotate and be done! But that’s not the best part of this nifty event logger. There’s a lot more going on. Let’s take a look at the initial logged event. Apart from the JSON representation of our APIGatewayProxyRequest object, we’ve also got a value telling us whether or not the invocation of the function was performed on a container that was cold starting (the initial ‘spinning up’ of the container).

How awesome is that? For anyone who’s spent time using Lambda and .NET, you’d remember that getting information on cold starts before now (aside from educated guessing) involved adding the CloudWatch Lambda Insights layer to your solution stack.
But wait! There’s more! (shades of 1990s late-night informercials for Queens collections of steak knives, anyone?) Let’s dig into the code a little more.

ALL THIS CAN BE YOURS FOR THE LOW LOW PRICE OF dotnet add
Along with the LogEvent parameter, you can configure several other options either via parameters in the annotation or as environment variables.
- POWERTOOLS_SERVICE_NAME — Let’s you define what your service is called and what will appear in the service parameter of each logged event.
- POWERTOOLS_LOG_LEVEL — This maps directly onto your standard debug, information, error, trace log levels, in line with other popular logging frameworks.
- POWERTOOLS_LOGGER_CASE — Lets you control the casing used in your events (as a snake_case evangelist, I don’t know why you’d even bother with the others ;))
- POWERTOLS_LOGGER_SAMPLE_RATE — This is an interesting one. Using a double here (from 0 to 1), you can control what percentage of your requests are logged automatically as DEBUG level logging, giving you a way to gather diagnostics over time without enforcing DEBUG always. Very cool!
Apart from the standard Logger methods like LogError and LogInformation, there’s an interesting one nestled in there called Logger.AppendKeys. This is very neat, as it lets you append a KeyValuePair to your log entries, and every entry after adding it will contain your KeyValuePair as a part of the output.
Where would this be useful? Imagine you had a function that allows a customer to enquire about membership information. If I were building this function, I’d probably want to accept the customer identifier and ‘attach’ it manually to the log entries so I can search aggregated logs in CloudWatch (via the awesome CloudWatch Insights query language) by customer id to filter out all the other customers.
With Logger.AppendKeys, I can create a key-value pair with my customer id:
var customerInfo = new Dictionary<string, string>()
        {
            {"CustomerId","CUST1234" }
        };
Then append it to the logger:
Logger.AppendKeys(customerInfo);
And — through the magic of power tools — we now have the customer id stamped neatly against all our subsequent log entries:

And that, at a glance, is the Logging portion of power tools for Lambda/.NET. Neat, huh? There’s probably more packed in there, but this is just me having an initial playaround.
Already, it’s apparent that this package will be easy to fold into our standard tooling simply because it’s easy to use and represents a way to lessen the code footprint we’ll need when building serverless functions.
A lot of the work we do today to write well-expressed logs will be taken care of via a nuget package and a quick annotation — magic! Just a reminder, if you want to play around with the sample GitHub code locally, you can do so via the same CLI using sam local invoke, as the repository has sample events already provided in JSON format. For our API Gateway example, you’d use:
sam local invoke HelloWorldFunction --event events/event.json
(Just don’t forget — like I did — that if you alter the source code and want to see the changes, you must do a sam build :D ). Kudos to the team behind the repository for making everything seamless to use locally or in AWS, with a provided DockerFile, sample events, clear instructions, and a responsive team to issues raised in GitHub!
Metrics

Throttles, duration, invocations, error rate. These are the bread and butter of your metrics whenever you bring a new Lambda function into the world. Useful though they are, the intrepid serverless developer will no doubt find a wealth of reasons to want to hook into even more information than the out-of-the-box metrics provide.
A few different options are available to developers, from adding Lambda layers to provide additional observability to crafting metrics from your logs via CloudWatch Insights. But for .NET developers, there’s another awesome tool made available with the recent GA announcement of Lambda Powertools for .NET: custom metrics.
So, how can we put custom metrics to use? And how easy does Lambda Powertools make the exercise? (Hint: Super easy).
Let’s walk through a simple example I’ve put together in Visual Studio to demonstrate how to set up and then report on custom metrics.
I’ve chosen to start with the Visual Studio template for the Lambda annotations framework (because it’s awesome — more on that another time) and have taken the liberty of creating a simple Lambda and API Gateway-powered HTTP API endpoint that we can use to get a feel for how custom metrics work.
First things first, the magical metrics package we need to add to our project:
dotnet add package AWS.Lambda.Powertools.Metrics
Next, let’s take a look at the function code I’ve put together in its entirety, and then we can pull apart the specifics:

I’ve set my Lambda handler up to accept a string of environments and an integer of metricValue. The response is a simple ApiResponse object that contains an HTTP status code and a message.
Because I’m using the Lambda annotations framework, setting up an HTTP API is a breeze. I decorate my handler with the HttpApi decorator specifying the HTTP verb, path, and parameters. In this case, I’ve created a post endpoint that accepts path parameters of {environment} and {metricValue} as an integer.
Additionally, I’ve decorated the handler with the configuration for my function (namely memory size and timeout). Thanks to the magic of the annotations framework, as I add or modify these configuration values, my serverless application model (SAM) template is automatically synchronised and updated with the configuration described in the code.
If that’s not literal sorcery, I don’t know what is.
The idea with this sample is that I’ll be able to call the API, pass a {metricValue} to it, and use those values to generate CloudWatch custom metrics I can view in AWS. So where does {environment} come in? Well, we’re going to use that to demonstrate dimensionality in metrics.
Essentially, we’ll be able to report metrics to the same namespace but report them as either /production or /development so that we can further slice our metrics by the dimension of environment.
So, let’s look at the actual pushing of our custom metric:

As you can see, we’ve pushed one single metric value to CloudWatch. We’re sourcing the value and dimension from our API endpoint; the rest has been hardcoded. The namespace will show in the CloudWatch console under custom namespaces, with the service and dimension(s) underneath the specific metric.
We’ve chosen our ‘metric unit’ as CountPerSecond, but a few options are available depending on the type of data you want to capture (examples being Seconds, BytesPerSecond, or Percentage).
With that one method, we should have everything we need to post the data to CloudWatch. Let’s deploy and see how it works!
(… one SAM-to-CloudFormation journey later…)
With our API deployed to AWS, let’s try invoking it with a custom metric value. To be slightly more efficient than just manually calling curl a bunch of times, I’ve put together the following PowerShell script, which will invoke my API a bunch of times, passing in random metric values each time within a range:
if (-not $args) {
  Write-Output "Usage: .\test_script.ps1 <api-id>"
  exit 1
}
$api_id = $args[0]
for ($i = 1; $i -le 1000; $i++) {
  $value = Get-Random -Minimum 1 -Maximum 300
  Invoke-RestMethod -Uri "https://$api_id.execute-api.ap-southeast-2.amazonaws.com/metrics/embedded/production/$value" -Method Post
  Start-Sleep -Seconds 1
}
So, let’s fire it off and see what happens!
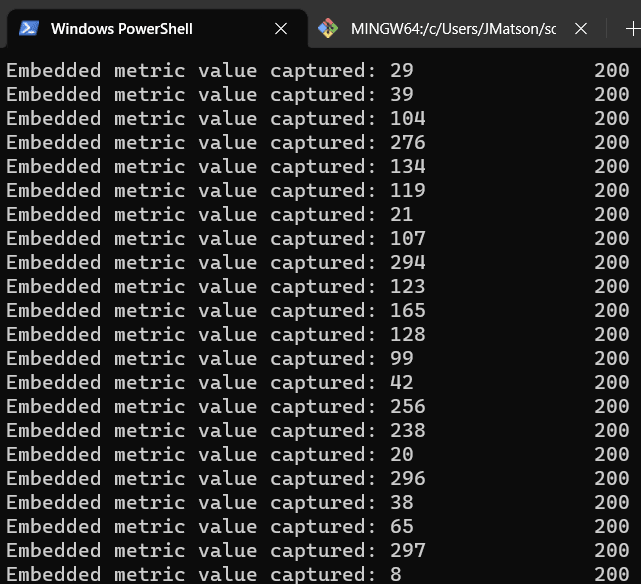
Excellent. My metrics are off (we hope) to CloudWatch. So, let’s log into the console and see what’s available.
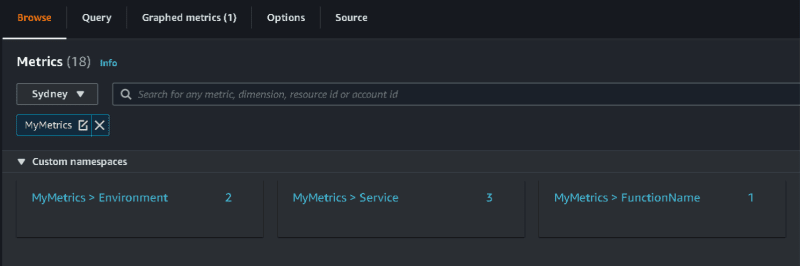
Excellent! Under custom namespaces, we can see our MyMetrics namespace available, including our custom dimension of Environment available alongside defaults like Service and FunctionName.
(Side note: You might have noticed the Lambda handler was also decorated with [Metrics(CaptureColdStart)]). This handy metrics feature lets you include Lambda cold starts in your metrics namespace and anything else you want to capture. That’s why there are three metrics available under MyMetrics > Service. One for cold starts, one for my custom metric, and one for, well, the same custom metric but with service_undefined as the service name because I forgot to include it the first time I created the sample :).
So, back to our custom metrics, as you can see, I’ve created a simple CloudWatch graph featuring my custom metric viewed in two ways. One is as a one-second average, the other as the maximum value simultaneously. From that, we get the line graph of our custom metric over time.

It’s really as easy as that, and while I’ve used a pretty abstract example here, you can imagine all the use cases just waiting to be explored. I know with my team, we’ll be able to utilise custom metrics in our serverless functions as a way to measure the performance of different dependent services without needing to do what we do today: log the data in our own custom JSON format and then ‘hand craft’ metrics via CloudWatch Insights.
In case you’re looking to reproduce the sample above, I’ve put the code into a small repository here:
 kknd4eva
/
AWS.Lambda.Powetools.Metrics.Sample
kknd4eva
/
AWS.Lambda.Powetools.Metrics.Sample
A small sample of using AWS Lambdatools for .NET
Hopefully, this has given you — the intrepid serverless guru — the motivation to add Lambda Powertools to your toolbelt. Please look for a future article where I’ll explore some of the other Powertools utilities.

Top comments (0)