If you're terminal-loving engineers using Kubernetes like us, kubectl is your constant companion. That's why the Kubecost team built a new CLI for interacting with Kubernetes cost data. Today, we’re announcing kubectl cost, an open-source extension that fits directly into your workflow.
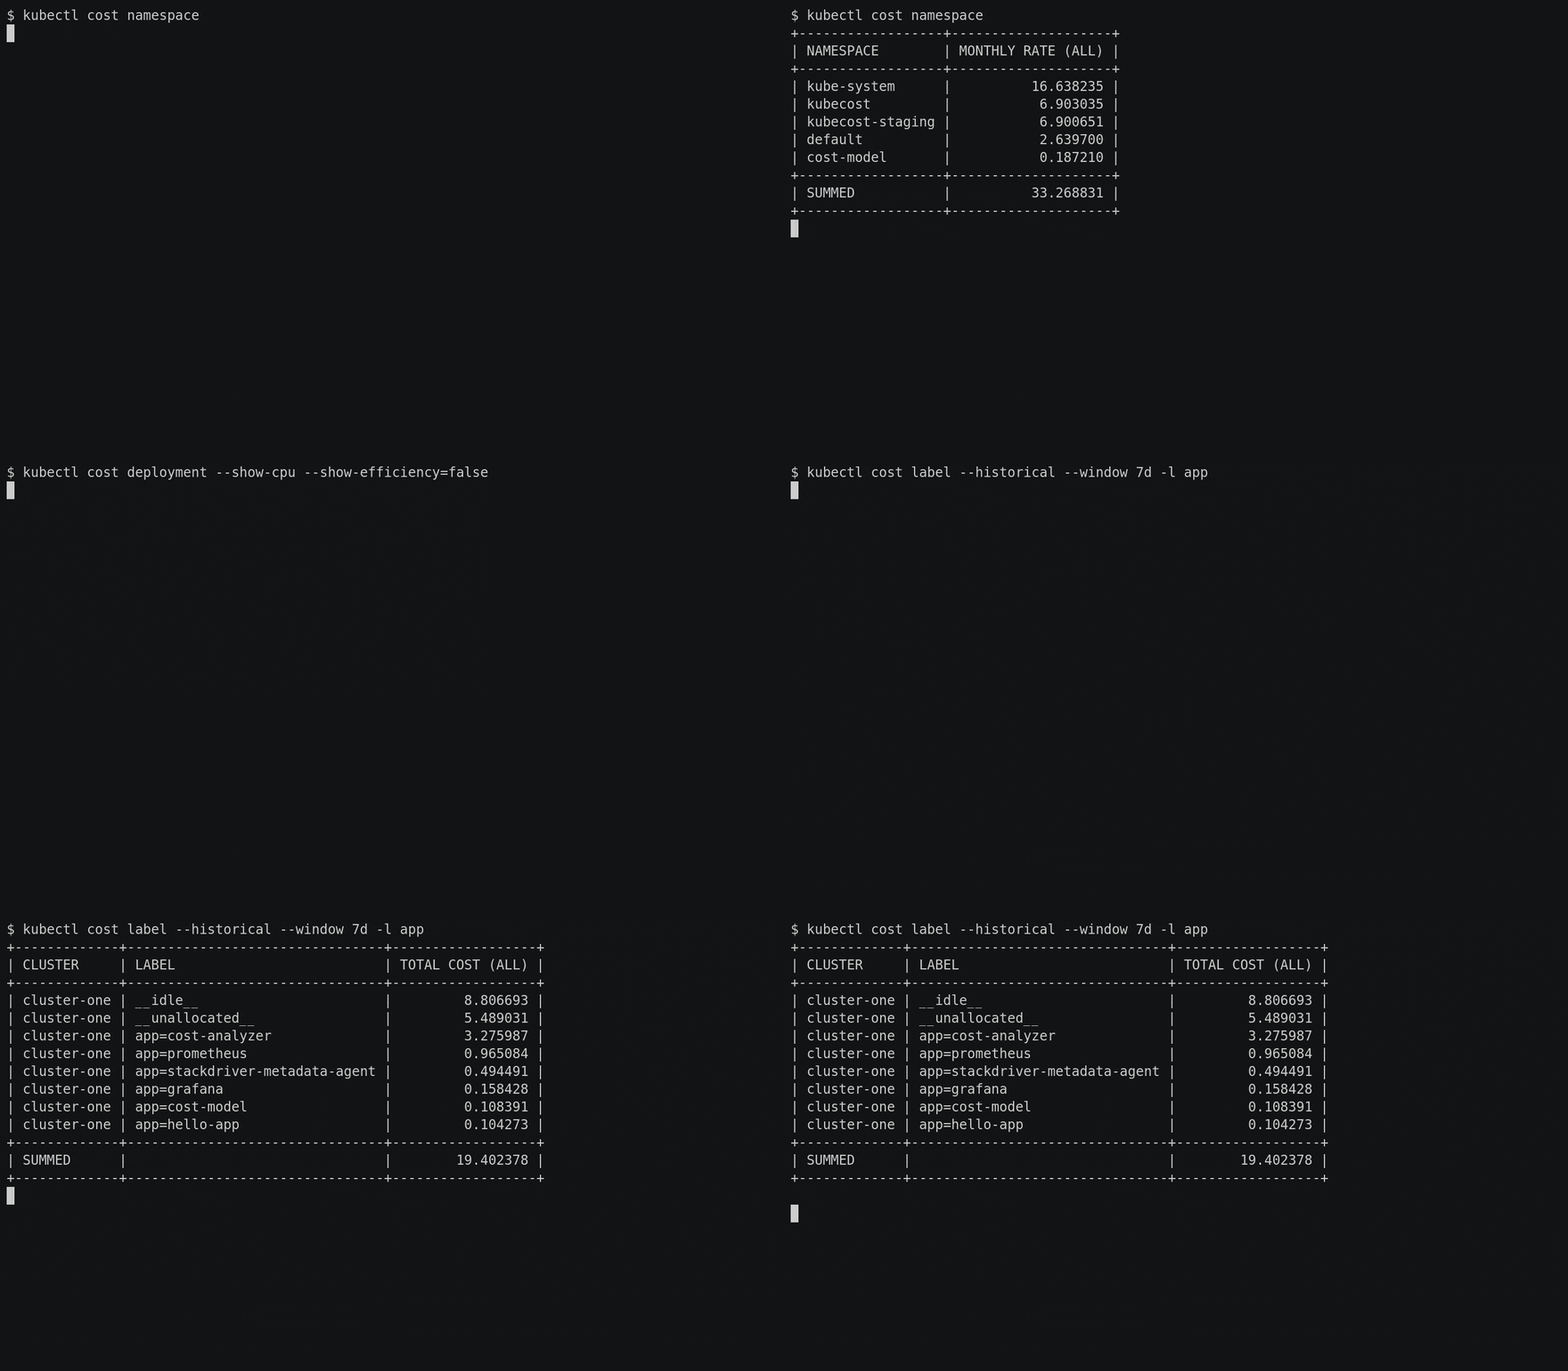
Here’s an example of it in action:
For teams running Kubernetes, gaining visibility into the cost of resources can be hard, especially in dynamic multi-tenant environments. Kubecost helps teams—developers, managers, executives, and everyone in-between—running Kubernetes understand their cluster spend precisely, all the way down to the pod level. One of our primary goals is to provide cost visibility into tools that teams are already using.
Kubectl cost is a kubectl plugin, a CLI tool designed for application and infrastructure engineers who interact directly with Kubernetes on a regular basis. They would benefit from understanding the costs of their various deployments and other in-cluster resources. With reporting a few keystrokes away on the familiar interface of kubectl, the cost plugin gives engineers quick and easy access to cost and spend efficiency information. At Kubecost, we believe that by making cost metrics more accessible we can help our users build more cost-efficient software systems. Let’s check it out.
How to use kubectl cost
The basic structure of kubectl cost is built around various aggregations that map to Kubernetes concepts, e.g. namespace, label, deployment, statefulset, etc. It leverages Kubecost APIs which provide users with programmatic access to useful data about workloads and assets in your clusters.
Let’s have a look at a few samples:
One of the simplest queries, showing a monthly cost projection for each namespace in your cluster based on the past day of activity. This accounts for all workloads and their resources in each label.
Total cost, over the past day, broken down by the value of the app label. This accounts for labels applied at both the namespace and workload-level.
Monthly rate projection broken down by deployment, including a more detailed look at CPU cost and CPU cost efficiency.
How much each namespace cost last month, including CPU cost and efficiency.
How much each namespace cost yesterday, with all resource-specific costs and efficiencies displayed. This highlights the granular detail at which Kubecost collects cost metrics.
How it works
- By default, Kubecost integrates with cloud provider billing APIs with support for AWS/EKS, Azure/AKS, GCP/GKE, and on-prem clusters via custom pricing sheets.
- Kubecost can integrate with your cloud provider billing data directly to accurately reflect enterprise discounts, spot prices, reserved instances, savings plans, and more.
- Compute and memory costs are calculated using the max of resource usage and resource requests.
- Network costs are optional and are enabled via the network-costs daemonset.
- Monthly rate projections are based on average run rate for each individual workload over the measured window.
Learning more
There’s tons more to discover, check out the documentation and kubectl cost --help to keep going. We’re also going to be adding more functionality in the coming weeks. So join our Slack community or reach out to team@kubecost.com if you have questions or additional features you’d like to see!


Top comments (0)