Google Chrome is one of the most popular browsers in the world. It offers powerful extensions that let developers enhance the browsing experience. From game hacks to productivity tools — if you can dream it, you can build it. And the best part? It’s surprisingly easy to get started.
In this tutorial, I’ll walk you through the simple steps to debug your own Chrome extension.
Before we dive in, check out my project, Face Blindness Saver — a Chrome extension that identifies celebrities in YouTube videos. You can use it to follow along with this guide today!
Step 1: Open the Chrome Extension Management Page
- Open Google Chrome.
- In the address bar, type:
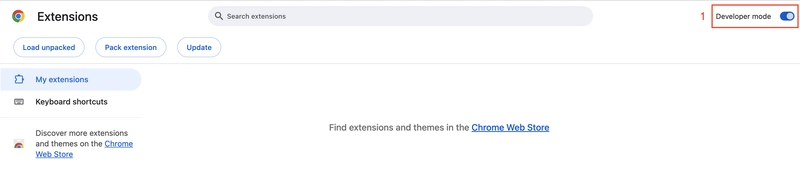
chrome://extensionsand hit Enter. - Toggle on Developer mode in the top-right corner.
Step 2: Load Your Extension
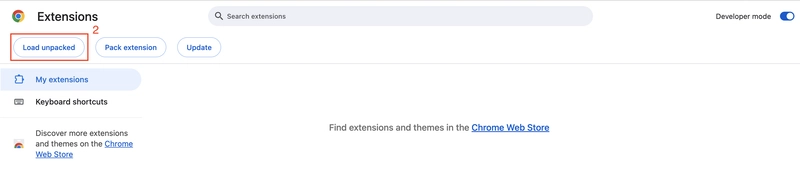
- Click the Load unpacked button.
- Navigate to your extension’s folder and select it.
- Chrome will instantly load the extension, and you’ll see it appear on the page.
Step 3: Run & Debug
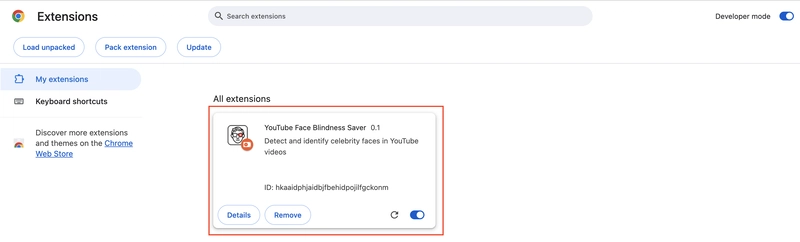
Congratulations! Your extension should now appear in the list of installed extensions. The extension will automatically start running. Now you can debug your extension just like any webpage — set breakpoints, log messages, and watch the magic happen.
And that's it! You're now ready to test and debug your Chrome extension!

Top comments (0)