
Written by Chimezie Innocent ✏️
In the world of big data, data analytics and data visualization go hand in hand. With data visualization tools and technologies, we can easily analyze massive amounts of information to make data-driven decisions.
By providing a graphical representation of data through data visualization types like charts, tables, maps, or graphs, decision-making can be streamlined.
In this article, we’ll learn how to build an analytics app to monitor and analyze raw data with React and Cube.js. This app will monitor raw product data from a database connected to a React dashboard through Cube.js, showcasing how much the product sells and how many customers the product sells to.
What is Cube.js?
Cube.js is an open source analytics platform that helps users create a semantic API layer on top of data to manage access control and aggregate the data. Because Cube.js is visualization agnostic, users can build frontends with any framework or library of choice.
 Graphic from GitHub.
Note that Cube.js is not a database; rather it is a headless API layer that connects databases to the frontend so users can build data applications faster.
It also manages caching and query queuing, and exposes the API for the frontend to build dashboards and other analytics features.
React and Cube.js tutorial prerequisites
Before we continue, you must have a basic understanding of React, PostgreSQL, and Recharts. Also, note that every command in this article runs on Linux, so the command variations in Windows and Mac may vary.
PostgresSQL database setup
Cube.js requires a database to store and get the analytics data, so we will use PostgreSQL as our database for this tutorial.
Downloading Postgres
Let’s start by downloading PostgreSQL, or Postgres, and creating our database:
# Create the file repository configuration:
sudo sh -c 'echo "deb http://apt.postgresql.org/pub/repos/apt $(lsb_release -cs)-pgdg main" > /etc/apt/sources.list.d/pgdg.list'

# Import the repository signing key:
wget --quiet -O - https://www.postgresql.org/media/keys/ACCC4CF8.asc | sudo apt-key add -

# Update the package lists:
sudo apt-get update

# Install the latest version of PostgreSQL.
# If you want a specific version, use 'postgresql-12' or similar instead of 'postgresql':
sudo apt-get -y install postgresql
With Postgres installed, we can log in and create a database, which we will later connect to Cube.js.
There are two ways we can create a Postgres database: we either use the postgres role to create the database or create a database as a new user. Let’s see how to use both.
Using the postgres role to create a database
To connect to Postgres using the postgres role, we must switch over to the Postgres account on the server by typing the following:
$ sudo -i -u postgres
This prompts us to enter the password for the current user; in this case, it will be your computer's password.
Then, we can access PostgreSQL using psql by typing the following command:
$ psql
Now, run this command to create a new database:
CREATE DATABASE ecom;

We have successfully created an ecom database.
Using a new user to create a database
With this method, we do not need to log into Postgres; we can simply run this command on the home terminal:
sudo -u postgres createuser testuser
This command creates a new Postgres user called testuser. You can name yours anything you see fit.
We can then create the database by running the following command:
sudo -u postgres createdb ecom
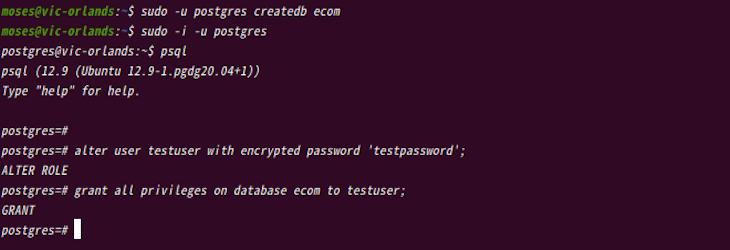
With the newly created database named ecom, let’s proceed to grant all privileges to the user we just created. To grant privileges, we must first log into Postgres:
sudo -i -u postgres
psql

alter user testuser with encrypted password 'testpassword';
grant all privileges on database ecom to testuser;
We can now try connecting remotely to our database by running the following command:
psql -h localhost -p 5432 -U testuser -d ecom -W
This command prompts for a password, so enter the database password to connect to the database. In our case, the password is testpassword.

Populating the database with data
Now that we have a working database, we can populate the database with an ecommerce sample dataset. We will use this dataset later when we configure our Cube.js service.
You can also use other sample datasets like this dvdrental, but be sure to read how to use it here.
To populate our database with the ecommerce dataset, run the following:
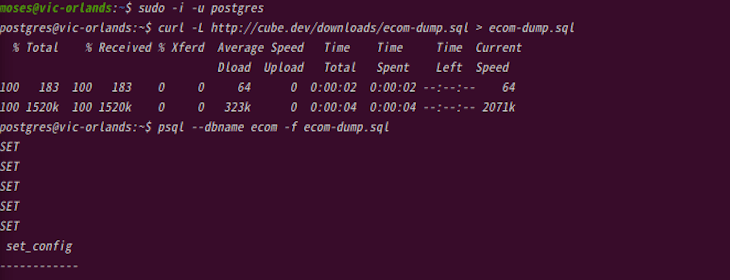
\q // to exit the psql terminal
sudo -i -u postgres // to login to postgres
curl -L http://cube.dev/downloads/ecom-dump.sql > ecom-dump.sql
psql --dbname ecom -f ecom-dump.sql
After successfully populating the ecom database, run this command to see the user’s relations count in the database:
psql // to enter psql command line
\c ecom // to connect or enter your database
SELECT count(*) FROM users;

"Relation" is the mathematical name for tables. So, the user's relations count is the total number of tables in the user’s relation.
We can also run \d+ to see the list of all relations in our database. And now, we’re done with the backend setup.
Cube.js setup
To scaffold our Cube.js project, run the following:
npx cubejs-cli create <project name> -d <database type>
Now we can set up our Cube.js project by running the command below:
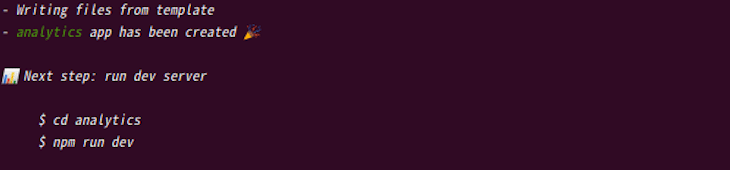
npx cubejs-cli create analytics -d postgres
This creates a new project with the name analytics and postgres as our database.
Next, let’s add the following Postgres database credentials manually to the .env file. This allows us connect our Postgres database to Cube.js:
CUBEJS_DB_TYPE=postgres
CUBEJS_DB_HOST=localhost
CUBEJS_DB_NAME=ecom
CUBEJS_DB_USER=postgres
CUBEJS_DB_PASS=testpassword
If you use different database names, such as user, fill it with your unique credentials.
Oftentimes we won’t see the .env file in our folder and we must check the options of seeing hidden files before we see the .env file. We can use the terminal to add the credentials by simply running the following commands:
cat .env   // to view the file in your terminal
vi .env    // to edit the file in your terminal editor
Press :wq! // keys to save the updated file and exit from the editor.
cat .env   // to see the updated file
After that, we cd into our folder and run the command below:
cd analytics

npm run dev
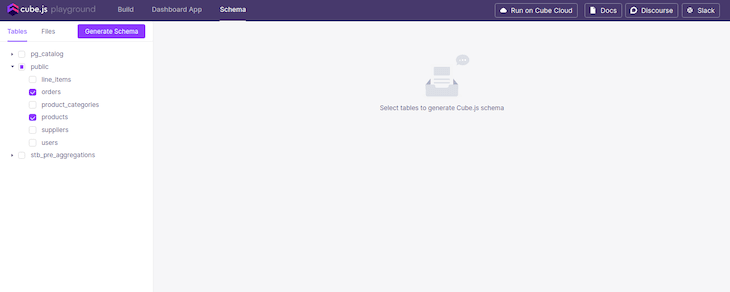
Let’s go to http://localhost:4000/ to view the Developer Playground where we also generate our data schema. You can read more on the Cube.js data schema.
Next, click the public dropdown menu, select products and orders, and click Generate Schema to generate the Order.js and Products.js schema files.
Note that in a situation where you stop the process using ctrl+z and try running it again, you might get an error. This is because the process still runs in the background while using the address.
To clear this error, kill the process and clear the address with the command below:
fuser -k 4000/tcp
Setting up the React app
This is the last part of this tutorial. Give yourself a round of applause for coming this far, you deserve it.
Now, let's go ahead and finish what we started. We can connect Cube.js to our React app in two ways:
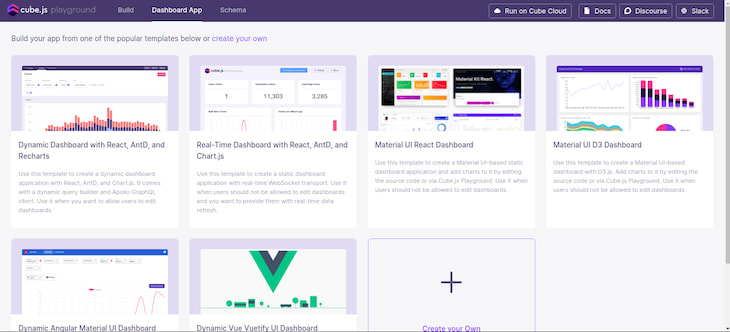
To use the Developer Playground, go to the Dashboard App section and either select any of the available templates or create a new app.
If you’re using an existing React app, you only need to install the packages or the dependencies you need and connect to Cube.js.
For this tutorial, we’ll use an existing React app, so we can go ahead and install the Recharts and Cube.js core packages:
npm i --save @cubejs-client/core @cubejs-client/react recharts
Now, let's import our installed packages into our Analytics.js file:
import React from "react";
import cubejs from "@cubejs-client/core";
import { QueryRenderer } from "@cubejs-client/react";
import { BarChart, Bar, XAxis, YAxis, Tooltip } from "recharts";
Finally, let’s import the three modules we installed, which are @cubejs-client/core, @cubejs-client/react, and recharts:
import React from "react";
import cubejs from "@cubejs-client/core";
import { QueryRenderer } from "@cubejs-client/react";
import { BarChart, Bar, XAxis, YAxis, Tooltip } from "recharts";

const cubejsApi = cubejs(
  "4c2a328092cda6a1944499663fcaf730c1622823fb714ee4e60ba4917cd9a773219d98df8aa91817813a9fffe012d8ebe0f507849719606a0722b0a47d08757d",
  { apiUrl: "http://localhost:4000/cubejs-api/v1" }
);

const Analytics = () => {
  return (
    <QueryRenderer
      query={{
        measures: ["Orders.count"],
        dimensions: ["Products.name"],
        timeDimensions: [
          {
            dimension: "Orders.createdAt",
            granularity: "day",
            dateRange: "last 3 days"
          }
        ]
      }}
      cubejsApi={cubejsApi}
      render={({ resultSet }) => {
        if (!resultSet) {
          return "Loading Analytics...";
        }
        return (
          <BarChart width={600} height={300} data={resultSet.rawData()}>
            <XAxis dataKey="Products.name" stroke="#8884d8" />
            <YAxis />
            <Tooltip />
            <Bar barSize={30} dataKey="Orders.count" stroke="#8884d8" />
          </BarChart>
        );
      }}
    />
  );
};
The @cubejs-client/core allows us to connect to our Cube.js backend, taking two parameters: our Cube.js secret token, which can be found in our .env file and the API URL, which is the Cube.js default URL in development mode.
@cubejs-client/react allows us to query our Cube.js backend from our functional React component, using the useCubeQuery Hook to execute this query. We can then pass the dimensions and measures we need to the Hook.
Also, here dimensions is our quantitative data like the number of units sold, the number of unique visits, or order counts, while measures is the categorical data like gender, product name, or units of time (like day, week, or month).
We can change the granularity query to week, month, or year, or change the dateRange to last {n} week, month, or year, respectively. We can also change the measures and dimensions according to the schemas generated.
With all our data, we can finally visualize it using BarChart, which is from the Recharts module. We can also use the LineChart, AreaChart, or PieChart that Recharts offers if desired.
Conclusion
We can use any database for our analytics app. To use MongoDB, simply download the mongodb instance and the MongoDB Connector for BI that helps write SQL queries on top of MongoDB.
We can also use any visualization packages that we are familiar with like D3.js or Charts.js.
Visit the Cube.js official website to learn how to authenticate your analytics app so users have different levels of access to the analytics data and utilize the many cool analytics features that Cube.js offers.
Full visibility into production React apps
Debugging React applications can be difficult, especially when users experience issues that are hard to reproduce. If you’re interested in monitoring and tracking Redux state, automatically surfacing JavaScript errors, and tracking slow network requests and component load time, try LogRocket.

LogRocket is like a DVR for web apps, recording literally everything that happens on your React app. Instead of guessing why problems happen, you can aggregate and report on what state your application was in when an issue occurred. LogRocket also monitors your app's performance, reporting with metrics like client CPU load, client memory usage, and more.
The LogRocket Redux middleware package adds an extra layer of visibility into your user sessions. LogRocket logs all actions and state from your Redux stores.
Modernize how you debug your React apps — start monitoring for free

Top comments (0)