Observable Plot is a robust JavaScript library to help you quickly visualize tabular data. With its concise API, you can easily layer multiple representations of your data into customizable graphics.
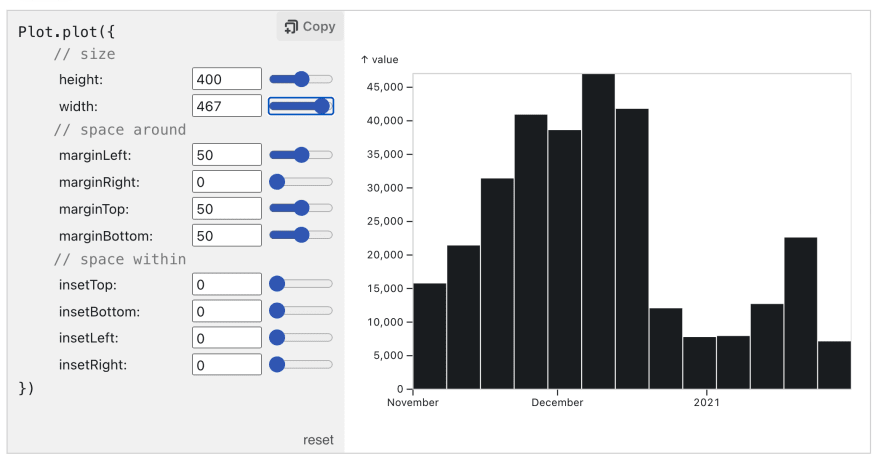
To help quickly grasp the universe of possibilities of the library, the Plot Cheatsheets offer an interactive way to explore the API. For example, want to understand all of the ways to adjust the spacing of your graphic? Reference the Layout cheatsheet to see all the ways to space out your chart:
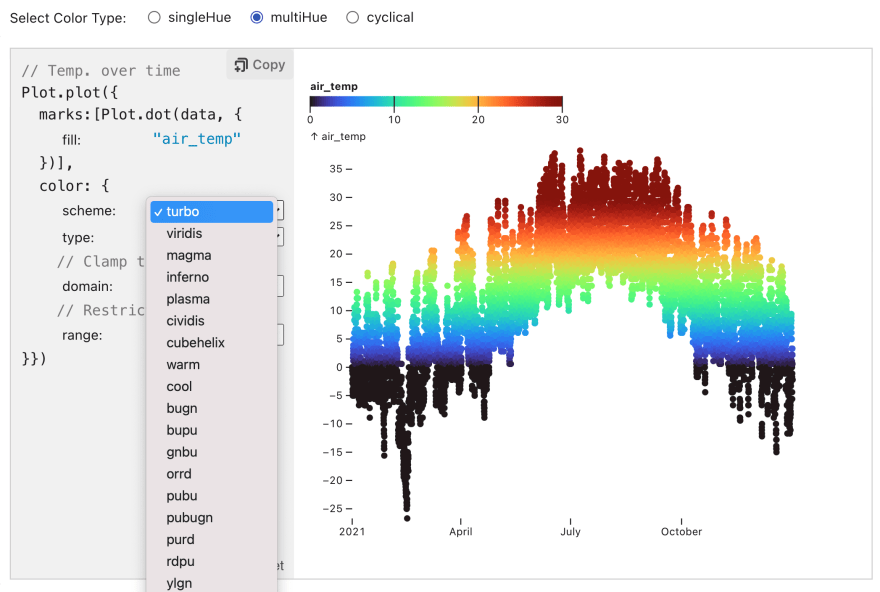
Looking for the right color? Explore color schemes using the Colors cheatsheet:
The cheatsheets provide offer both an interactive reference and printable PDF for each of the foundational concepts of the library: Marks, Scales, Transforms, Layout, and Colors. The single-page views offers a quick scan through the set of possibilities:
Click here to download the full set of PDFs.
While Plot can be used in any JavaScript project, it works especially well on Observable, which is free for individuals to use. For context, Observable is a collaborative, web-based platform for data practitioners and the decision makers they empower. Our hope is to unite disparate data analytics, visualization, and science tools in order to help them make better decisions using data.


Latest comments (0)