
Abstract
Climate is changing rapidly, and these changes must be monitored continuously, especially with satellite observations.
The Japan Aerospace Exploration Agency (JAXA) publishes Earth observation images, such as temperature, precipitation amount, vegetation, etc., which can be retrieved using the JAXA Earth API.
This post describes how to retrieve georeferenced observation images using the JAXA Earth API plugin for QGIS.
JAXA Earth API overview
JAXA Earth API is a satellite data distribution service, written in Python and javascript.
Description and available dataset are detailed in the official website : https://data.earth.jaxa.jp/
Observation images can be retrieved easily, but it would be better to overlay onto a basemap, that is why the use of a Geographic Information System (GIS) such as QGIS may be useful.
The use of QGIS JAXA Earth API Plugin
QGIS is an Opensource GIS software, and we can gather and analyse geographic data easily.
QGIS is also customizable using python scripts or adding plugins on.
Here is a procedure to install QGIS JAXA Earth API Plugin and retrieve satellite data.
1. On QGIS and add OpenStreetMap basemap
- Open QGIS
Basemap should be used as background to show map context.
It can be added on QGIS as XYZ tile.
- On browser, right click on XYZ tiles
- New connection…
- Put a name to this connection and input
https://tile.openstreetmap.org/{z}/{x}/{y}.pnglink as URL - OK

OpenStreetMap should be displayed on map canvas.
2. Install JAXA Earth API Plugin
- Menu -> Plugins -> Manage plugins...

- On plugin manager, search for
JAXAand install
Once plugin installed, JAXA Earth API icon should appear on tool bar
- By clicking on plugin icon, plugin dialog should appear

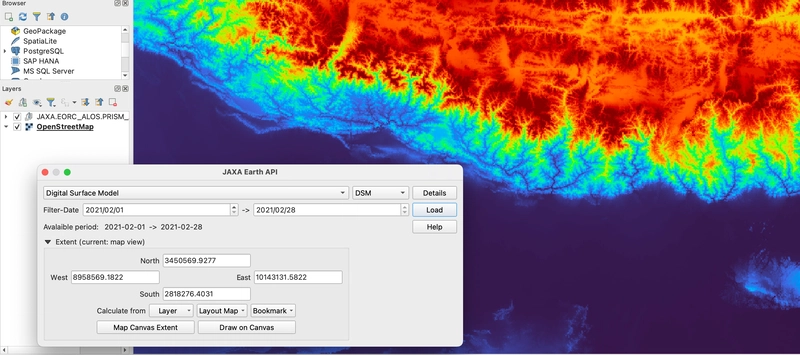
3. Plugin use example
- 1. Choose target dataset (here precipitation rate monthly)
- 2. Choose target period
- 3. Choose target map extent
- By clicking on
Map Canvas Extentbutton, map current is set - Custom extent can also be set by clicking on
Draw on Canvasbutton
- By clicking on
- 4. Push
Launchbutton to load data

Dataset is loaded as one layer per month!

At last
- Regarding results, precipitation rate evolution can be checked monthly.
Animation of this evolution can be made using TimeManager plugin
If you see any bug or have an enhancement idea, feel free to put an issue here :
https://github.com/MIERUNE/qgis-jaxa-earth-plugin

Top comments (0)