
The use of metrics in management is a progressive and modern practice especially in such a digitalized environment as IT business. And what hasn't been the IT business in the last decade? Everywhere, from the flower trade to the automotive industry, IT is a key factor for success. Metrics allow us to make competent management and engineering decisions, correctly allocate the budget, increase transparency, and achieve fairness and objectivity.
But this noble undertaking has a serious obstacle (we will leave the philosophical problem “Can everything be reduced to a number” for another, specialized platform and dystopias like “Black Mirror”). In business, there are very many metrics, but in IT there are hell of a lot of them. As a result, the amount of data increases and the number of observed parameters also increases. We are beginning to divide metrics into primary and secondary, metrics for business and metrics for “techies”. We lose focus and instead of transparency we get a disjointed set of thousands of indicators. By diving into their metrics, employees lose sight of any organization’s core purpose: to facilitate the pains of their customers and make their lives better, and be rewarded for it. The result is what is commonly called the “watermelon effect”, where the peel of “green” metrics hides the “red and hot” core of our business - customer (dis)satisfaction.
Ideal metric
I first encountered the “watermelon effect” at the very beginning of my career. Then I worked as a network engineer in a regional telecom operator and my responsibilities included processing metrics from a monitoring system to prepare a KPI report about the technical block. The report was based on the data of whether or not a communication node can be pinged (without binding the number of subscribers that depended on it). But in life the quality of services from the provider is determined not by the passage of ICMP packets from the monitoring server to the switch in the apartment block, especially when these switches are in their “sterile VLAN”. The subscribers of a new service at that time, IPTV via multicast, probably did not know about it but were fully able to feel it themselves. Hanging pictures on subscribers' TVs did not correlate in any way with the beautiful green picture seen on the management table, and the bonus fund. The result was a failed IPTV marketing campaign and a slightly shaken reputation. And further along the chain, a revision of the KPI for engineers followed with the inclusion of a bunch of new metrics (some of them business inclined), a bunch of weights that were simply impossible to calculate and difficult to factorize. And as the icing on the cake is the perception of KPIs by employees as a repressive tool to cut wages and complete ineffectiveness of its regulatory function. I believe that many people might have similar examples from practice, especially if they deal with such sensitive topics as KPIs and SLA. In general, the topic of KPIs, especially in IT, deserves a separate action-packed novel.
I remembered the story described above when recently several corporate customers almost simultaneously addressed us with the problem of non-transparent calculation of SLA and KPI of their IT departments. It is worth explaining that now I am working on a product for unified (“umbrella”) monitoring of IT infrastructure for rapid detection and elimination of IT failures, and our product is used by a number of very large clients from various fields: from government and fintech to media and airlines.
Mindful of my bad experience in the first place of work, I didn't really want to get involved in KPIs and SLA. At first I proposed to solve this problem by setting up an appropriate Service Desk, all the more so this is what ITSM recommends (Service Desk is a single point of entry and aggregation of all information about services). While my product will only continue to register incidents and help with their deduplication by identifying massive failures and understanding of whether or not a new alert relates to a currently existing problem under the control of engineers. But the colleagues did not want just a tool for reporting and repressive control, as I initially mistakenly assumed - they wanted a management tool that would help both business and engineers find a certain common language and add transparency to their relationships.
As a result, we agreed that one of the possible solutions is to create a single synthetic (integral) metric that is understandable to all parties. At the very least, the introduction of such a metric will reduce digital noise and, what is important, will give our IT department a certain benchmark of whether or not the right business decisions were taken. Ideally such a metric should also allow an unbiased assessment of which area in our IT environment we should focus on (helpful for budget planning and project portfolio). Thus, this ideal synthetic metric must satisfy the following criteria.
- To be business oriented: the metric should reflect the functioning of our IT environment not from the point of view of any server performance but from the point of view of how important it is to our clients.
- Comprehensibility: the metric can be unambiguously interpreted by both technicians and managers.
- Decomposability: the metric structure should allow us to conduct analysis and decompose our unified synthetic metric into its components/factors and highlight the most critical ones. In an ideal case one can hope to get a functioning mechanism for root cause analysis as the output.
As a result, two variants of implementation were proposed: 1) separate metric of availability for each service/object, 2) combined health map for the system as a whole. The health map turned out to be more complicated both in implementation and in analytical support, and was defined as a target for the final scheme. Meanwhile a simpler and more familiar approach was chosen for assessment of availability of services which will be discussed further.

Service availability is about business, but also about IT
So what is service availability? I formulated the following definition for myself: Service Availability is a state of our IT environment when our customers want to receive and can receive a service and stay satisfied by its quality. It is worth emphasizing that there can be only two states here: either the conditions are met or not. All halftones only blur the picture. No degradation, no degraded performance - these are technical metrics that are exclusively required by engineers to assess the dynamics of the system state.
Let me give an example: a potential client wants to apply online for a loan at a bank but the system is malfunctioning. Due to a high waiting time for the server's response, the form is constantly being reset or errors occur in it, but with some effort an application can be submitted in 30 minutes. This leads to the fact that the conversion rate in the sales funnel drops sharply. From the standpoint of classical engineering monitoring, this is a serious degradation but the service is still available, but from the standpoint of a business, this is an unacceptable state of the system when it loses potential customers. In this example, the availability of the service should be considered equal to 0. I will give the opposite example: due to some unforeseen circumstances, a whole data center is completely shut down but our systems go to the backup servers and for the clients everything looks normal, albeit a little slower than usual, applications for loans are registered and the conversion rate in the sales funnel does not fall. Here we say that the service is fully available and we, as engineers, are good fellows since we have provided a hot backup for the services. At the same time, half of our servers and communication channels are in a coma and are “not available”. Thus, determining the availability of a service is entirely on the side of the business, and we only need to record the appropriate state of our IT environment. You can succumb to the temptation to make everything simple and hand out, for example, the conversion rate metric as a KPI for the IT department but that would be wrong since IT infrastructure is not about conversion rate - its normal work is a necessary but not sufficient condition for propagating customers along the sales funnel. Therefore, the use of business metrics head-on will lead to misunderstanding and rejection on the side of engineering staff. Unfortunately managers often succumb to this temptation of simplifying and, as a result, get exactly the opposite effect.
Specifics of implementation
It is necessary to clarify that in our umbrella monitoring system we often deal not with metrics, but with specific events, alerts that have arisen in various monitoring systems. These alerts are considered to be coming from different configuration units (services, servers, virtual machines, clusters, etc., hereinafter referred to as CU) in the resource-service model. Also we have special objects, so called synthetic triggers, which can change their status depending on the incoming events (synthetic because they can be calculated based on alerts from different monitoring systems, hereinafter ST). In essence, a synthetic trigger is a generalization of an emergency or a business problem that has a beginning and an end.
In our system, we allow calculating the availability of both an individual CU and the aggregate availability of a CU group. The availability metric for a CU group is the desired top-level metric of the end service availability, because a service often turns out to be a whole complex of information systems and, in general, can represent a chain of smaller services (the data center is responsible for providing virtual machines, the cloud for the service of system components, the information systems for application services, and so on). In turn, the availability of a separate CU is an assessment of its performance from the point of view of providing the final service. This interconnection allows to carry out factor analysis and determine the contribution of each CU to the overall result, thus finding a bottleneck.
When building an availability report, it is necessary, first of all, to define a list of emergency situations or their aggregate that indicate a disruption of the service. Also one should define such additional parameters as:
Service working hours. For example, is it important that the service is available only during daytime hours or only on holidays?
Do we have an RTO (recovery time objective) - the maximum allowable time during which our object can be in an emergency state?
Whether or not we take into account the agreed service windows.
In addition, it is worth considering the confirmation of emergency situations by engineers (if we trust them, and we have such a mechanism), because monitoring systems tend to make mistakes sometimes.
The actual technique
So, first, let's calculate the availability for a single CU. By this stage, we have already configured all the problem filters and decided on the parameters of our calculations.
To calculate the service availability (SA) for a particular period, it is necessary to construct a function of the CU problem status versus time, fProblem(t), which can take one of the four values at any moment of time:
- The value (0) means that at the moment the CU has no problems that correspond to the filter,
- The value (1) means that the CU has a problem which passes the filter conditions,
- The value (N) says that the CU is in an unattended state,
- The value (S) says that the CU is in an agreed service mode.
As a result, we get the following indicators:
- timeNonWorking - the aggregate CU non-working time span in the considered period. The function value was "N".
- timeWorkingProblem - the time spent by the CU in a state that does not meet the SLA requirements in the investigated period of time. The function value was "1".
- timeWorkingService - agreed idle time when the CU was in a service mode, during working hours. The function value was "S".
- timeWorkingOK - the time span during which the CU satisfied the SLA requirements. The fProblem(t) function had state "0".
The calculation of availability for a single CU for a given period (Service Availability) is carried out according to the formula:
SA = timeWorkingOK / (timeWorkingOK+timeWorkingProblem) * 100%

Fig. 1 An example of possible distributions of time intervals when calculating SA (Service Availability) for a single CU

Fig. 2 An example of the influence of RTO on the calculation of the function fProblem(t)
For calculations of a CU group availability, Service Availability Group (SAG), it is necessary to build the function fProblem(t) for each CU included in the group. Next, one should superimpose the resulting functions fProblem(t) for each CU on top of each other, using certain rules (see Table 1).
Table 1.

In the end we get the function fGroupProblem(t). We sum up the duration of the segments of this function as follows:
- timeGroupService - time when fGroupProblem(t) = S,
- timeGroupOK - time when fGroupProblem(t) = 0,
- timeGroupProblem - time when fGroupProblem(t) = 1.
Thus, the required metric is defined as:
SAG = timeGroupOK / (timeGroupOK+timeGroupProblem) * 100%
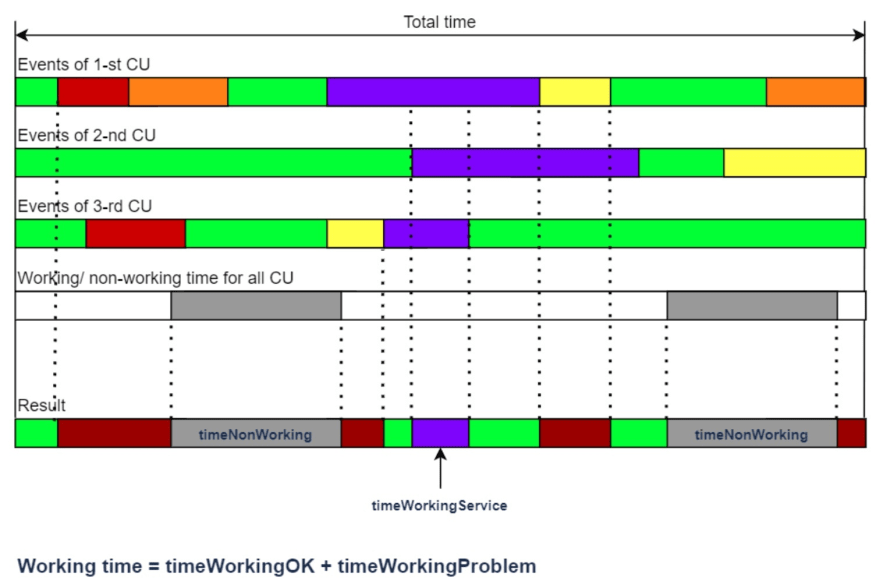
Fig. 3 An example of possible distributions of time intervals for calculating availability of a KE group
Factor analysis
As I noted above, it is important not only to get the metric, but also to be able to decompose it into its components, in order to eventually understand which problems became critical, and which ones, on the contrary, made the least contribution to the current situation. This will allow us, for example, to understand where we should invest our limited budget to deal with the reddest spot in our system.
Factor analysis allows us to determine how a particular problem influenced the calculation of availability during the reporting period and compare the degree of such influence with all the other problems.
Method assumptions:
- In the method of determining the availability, it is impossible to define the weight of a particular problem if several problems occurred simultaneously. In this case, the only parameter will be the duration of the problem.
- If two or more problems occur simultaneously, then for such a period we will consider the duration of each with the weight of 1/N, where N is the number of problems that occurred simultaneously.
Calculation method:
- It is necessary to take the function fProblem(t), built when calculating SA.
- For each segment, where the final function fProblem(t) = 1, make a list of the problems of this CU on the basis of which this segment was assigned the value of 1. When compiling the list, it is necessary to take into account the problems that began or ended outside the time span of the function.
- Assign to each problem a metric of influence. It is equal to the duration of the problem in the segment multiplied by the corresponding weight. If there was only one problem in the segment the problem is assigned a weight equal to 1. In the case of multiple problems, the weight is equal to 1 / N, where N is the number of simultaneously occurring problems.
- When calculating, the following points should be taken into account: In the general case, on the same segment at different intervals, the weight of the problem could change due to the appearance of new problems. The same problem can be present at different segments of fProblem(t) = 1. For example, a problem started on Friday, ended on Tuesday, and on weekends the CU is not serviced according to the SLA.
- Eventually, a list of problems should be formed that were taken into account in the calculation of the function fProblem(t). At the same time, a metric of influence on SA should be calculated for each problem.
- It is imperative to verify the calculation. The sum of the impact metrics for all problems must be equal to timeWorkingProblem.
- The user usually needs to display the relative value of the influence in percentages. To do this, the impact metric must be divided by timeWorkingProblem and multiplied by 100%.
- If you need to group problems and show the influence of the group, it is enough to sum up the metrics of all the problems included in the group. This statement is true only if the following condition is met: each problem is included in only one group at a time.
As a result, we get the following picture (see Fig. 4.). We have done it in AIOps platform for monitoring and event management monq.

Fig. 4 Analysis and assessment of problems in calculating availability in monq
Intermediate results
A service availability metric has all three essential properties of an ideal metric: clarity, decomposition, and business orientation. Thanks to this metric, it is possible to unambiguously assess the health of the IT environment from the standpoint of your business, and to keep the engineering staff focused on the most important thing - the level of service it provides. But there are also a number of serious shortcomings. The proposed methodology for calculating availability metrics is of a retrospective nature and does not allow making forecasts. There is no risk assessment, which does not allow us to make prompt decisions in the elimination of accidents.
Despite a number of limitations, the proposed method was positively received by our users, both on the part of the management and on the part of the engineering staff. During development, a positive perception from the two sides at once was the most important indicator for us that we are on the right track. At the moment, we are actively implementing this metric into working practice of IT departments for several of our clients. One of the fintech customers proposed to impose financial losses on the obtained time values of service availability and, thus, try to evaluate in monetary terms how justified certain investments in improving the IT infrastructure will be.
In any case, this is not our last attempt to find the “Holy Grail”, the ideal metric and method of calculating it, in order to help our clients not turn their IT environment into the above mentioned “watermelon”. Our next milestone is the “health map”. I hope to continue to share the results with you in the future.

Top comments (1)
Advice is not a noble thing :)
I think that very soon it will be possible to abandon such outsourcing companies (however this one could be very cool). If you have a large project, then take a few smart guys, let them set up the right environment for themselves to conduct a support project in Jira. Zabbix, Prometheus can be used as monitoring of infrastructure components, graylog or monq can be used as log analysis, and opsgenue or monq can be used as a component of automation and event management. Thus, the ROI will be significantly higher, and there will also be a big gain in flexibility. The only downside is that you can't pass the responsibility on to anyone.