Envoy Proxy
Envoy is a modern, high performance, small footprint open source edge and service proxy, designed for cloud-native applications. Originally written and deployed at Lyft, Envoy has become the proxy of choice for a variety of service-meshes including the more popular Istio Service Mesh.
Istio Service Mesh
Developed by a collaboration between Google, IBM, and Lyft, Istio is an open-source service mesh that lets you connect, monitor, and secure microservices deployed on-premise, in the cloud, or with orchestration platforms like Kubernetes.
Istio uses Envoy sidecar proxies aka istio-proxy as its data plane. In Kubernetes these proxies as deployed as Sidecars in all participating pods (either manually or automatically using sidecar injection) and are programmed to intercept all inbound and outbound traffic through iptable redirection.
Envoy Access Logs
Envoy Proxy provides a configurable access logging mechanism. These access logs provide an extensive amount of information that can be used to troubleshoot issues.
Most envoy proxy deployments use the default log format, as shown below,
[%START_TIME%] "%REQ(:METHOD)% %REQ(X-ENVOY-ORIGINAL-PATH?:PATH)% %PROTOCOL%"
%RESPONSE_CODE% %RESPONSE_FLAGS% %BYTES_RECEIVED% %BYTES_SENT% %DURATION%
%RESP(X-ENVOY-UPSTREAM-SERVICE-TIME)% "%REQ(X-FORWARDED-FOR)%" "%REQ(USER-AGENT)%"
"%REQ(X-REQUEST-ID)%" "%REQ(:AUTHORITY)%" "%UPSTREAM_HOST%"\n
which results in log lines as follows,
[2016-04-15T20:17:00.310Z] "POST /api/v1/locations HTTP/2" 204 - 154 0 226 100 "10.0.35.28"
"nsq2http" "cc21d9b0-cf5c-432b-8c7e-98aeb7988cd2" "locations" "tcp://10.0.2.1:80"
These logs, even in their default format, pack a lot of useful information that can come in handy in debugging issues with the L4-L7 proxy.
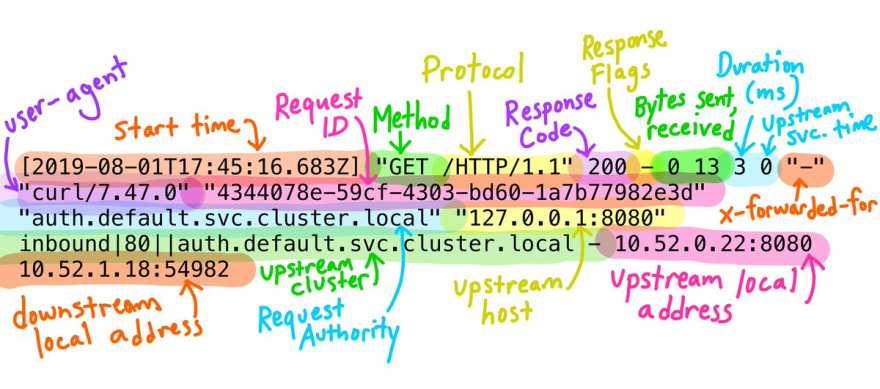
A recent tweet by Meghan O'Keefe from Google, provides a pretty visual representation of each field in the default envoy log (shown below).

 Megan O'Keefe@askmeegs
 Have you ever looked at Istio's proxy logs and thought: 😱 ?
These are @EnvoyProxy access logs, and contain lots of helpful info! envoyproxy.io/docs/envoy/lat…20:43 PM - 01 Aug 2019
In addition to the tweet, this medium blog by Richard Li (CEO, Datawire - the guys who brought you Ambassador), titled "Understanding Envoy Proxy HTTP Access Logs", provides more details on each of the fields of the default format log.
If you've ever had to deal with these logs like me, you know how difficult it is to grok each of the fields manually as the lines scroll by at the speed of light, especially in a busy network.
To address this problem and to make more sense of these cryptic log lines, I have created an open-source tool that I would like to present to the community.
Introducing Engarde
(Envoy + On Gaurd = Engarde ... Get it 😉 ?? Bah neverming, I tried)
Engarde is an open-source utility written in Go with (a lot of) help from the open-source grok package, that allows you to parse envoy access logs like a champ. In addition Engarde also supports the default format used by the istio-proxy (shown below).
[%START_TIME%] \"%REQ(:METHOD)% %REQ(X-ENVOY-ORIGINAL-PATH?:PATH)% %PROTOCOL%\" %RESPONSE_CODE% %RESPONSE_FLAGS% \"%DYNAMIC_METADATA(istio.mixer:status)%\" %BYTES_RECEIVED% %BYTES_SENT% %DURATION% %RESP(X-ENVOY-UPSTREAM-SERVICE-TIME)% \"%REQ(X-FORWARDED-FOR)%\" \"%REQ(USER-AGENT)%\" \"%REQ(X-REQUEST-ID)%\" \"%REQ(:AUTHORITY)%\" \"%UPSTREAM_HOST%\" %UPSTREAM_CLUSTER% %UPSTREAM_LOCAL_ADDRESS% %DOWNSTREAM_LOCAL_ADDRESS% %DOWNSTREAM_REMOTE_ADDRESS% %REQUESTED_SERVER_NAME%\n
Engarde reads in the envoy logs, line by line, via STDIN, marshaling them into JSON objects, for enhanced readability, and eventually outputting them back to the terminal over STDOUT.
Getting Started with Engarde
To get started with engarde just visit https://github.com/nitishm/engarde and follow the instructions provided in the README.
Sample
Envoy Default Format
echo '[2016-04-15T20:17:00.310Z] "POST /api/v1/locations HTTP/2" 204 - 154 0 226 100 "10.0.35.28" "nsq2http" "cc21d9b0-cf5c-432b-8c7e-98aeb7988cd2" "locations" "tcp://10.0.2.1:80"' | engarde | jq
{
  "authority": "locations",
  "bytes_received": "154",
  "bytes_sent": "0",
  "duration": "226",
  "method": "POST",
  "protocol": "HTTP/2",
  "request_id": "cc21d9b0-cf5c-432b-8c7e-98aeb7988cd2",
  "response_flags": "-",
  "status_code": "204",
  "timestamp": "2016-04-15T20:17:00.310Z",
  "upstream_service": "tcp://10.0.2.1:80",
  "upstream_service_time": "100",
  "uri_path": "/api/v1/locations",
  "user_agent": "nsq2http",
  "original_message": "[2016-04-15T20:17:00.310Z] \"POST /api/v1/locations HTTP/2\" 204 - 154 0 226 100 \"10.0.35.28\" \"nsq2http\" \"cc21d9b0-cf5c-432b-8c7e-98aeb7988cd2\" \"locations\" \"tcp://10.0.2.1:80\""
}
Istio-proxy Default Format
kubectl logs -f foo-app-1 -c istio-proxy | engarde --use-istio | jq
{
  "authority": "hello-world",
  "bytes_received": "148",
  "bytes_sent": "171",
  "duration": "4",
  "method": "GET",
  "protocol": "HTTP/1.1",
  "request_id": "c0ce81db-4f5a-9134-8a5c-f8c076c91652",
  "response_flags": "-",
  "status_code": "200",
  "timestamp": "2019-09-03T05:37:41.341Z",
  "upstream_service": "192.168.89.50:9001",
  "upstream_service_time": "3",
  "upstream_cluster": "outbound|80||hello-world.default.svc.cluster.local",
  "upstream_local": "-",
  "downstream_local": "10.97.86.53:80",
  "downstream_remote": "192.168.167.113:39953",
  "uri_path": "/index",
  "user_agent": "-",
  "mixer_status": "-",
  "original_message": "[2019-09-03T05:37:41.341Z] \"GET /index HTTP/1.1\" 200 - \"-\" 148 171 4 3 \"-\" \"-\" \"c0ce81db-4f5a-9134-8a5c-f8c076c91652\" \"hello-world\" \"192.168.89.50:9001\" outbound|80||hello-world.default.svc.cluster.local - 10.97.86.53:80 192.168.167.113:39953 -"
}
The real power of engarde can only be harnessed when it is combined with jq.
JQ + Engarde
jq is a lightweight and flexible command-line JSON processor. jq is like sed for JSON data - you can use it to slice and filter and map and transform structured data with the same ease that sed, awk, grep and friends let you play with text.
As shown in the examples above jq, at its most basic, pretty prints JSON strings into readable objects to your terminal. However, jq is capable of a lot more.
Since this blog is about Engarde I will not dive too deep into the capabilities of jq (which easily affords a post of its own).
Instead lets look at how we can use jq to filter envoy access logs by status_code and output only a subset of fields to STDOUT,
kubectl logs -f foo-app-1 -c istio-proxy | engarde --use-istio | jq -c 'select( .status_code = 200) | {log: .original_message, URI: .uri_path, UpstreamCluster: .upstream_cluster}' | jq
{
  "log": "[2019-09-06T19:11:40.645Z] \"GET /v1/health/service/xyz?index=0&wait=10s HTTP/1.1\" 500 - \"-\" 0 23 0 0 \"-\" \"Python-urllib/2.7\" \"83484d3a-fedb-96f5-a653-1c38fa1ac2e4\" \"10.15.12.33:8500\" \"10.15.12.33:8500\" PassthroughCluster - 10.15.12.33:8500 192.168.89.3:34780 -",
  "URI": "/v1/health/foobar",
  "UpstreamCluster": "PassthroughCluster"
}
{
  "log": "[2019-09-06T19:11:42.218Z] \"GET /metrics HTTP/1.1\" 200 - \"-\" 0 0 1 0 \"-\" \"Prometheus/2.9.1\" \"e8810c98-9e10-9b2c-837e-987ec3ed3614\" \"192.168.89.3:9001\" \"127.0.0.1:9001\" inbound|80|foo-worker|hello-world.foo-namespace.svc.cluster.local - 192.168.89.3:9001 192.168.167.109:53458 -",
  "URI": "/metrics",
  "UpstreamCluster": "inbound|80|foo-worker|hello-world.foo-namespace.svc.cluster.local"
}
{
  "log": "[2019-09-06T19:11:47.218Z] \"GET /metrics HTTP/1.1\" 200 - \"-\" 0 0 1 0 \"-\" \"Prometheus/2.9.1\" \"f4cd2b2b-7202-9823-a8cd-7a150c6b5c4a\" \"192.168.89.3:9001\" \"127.0.0.1:9001\" inbound|80|foo-worker|hello-world.foo-namespace.svc.cluster.local - 192.168.89.3:9001 192.168.167.109:53458 -",
  "URI": "/metrics",
  "UpstreamCluster": "inbound|80|foo-worker|hello-world.foo-namespace.svc.cluster.local"
}
...
...
Fin
Feel free to share some feedback either directly or through opening an issue on Github. Would love to hear what you think about it and if you wish to see any enhancements.
And don't forget to ⭐ the project on GitHub and follow me at https://github.com/nitishm.


Top comments (0)