When you can't find a Grafana plugin that does exactly what you want, you can always create your own Plugin. And this is what this post is about: how to create a Grafana plugin. But as there are many excellent resources already covering this subject, let's focus on a plugin type not broadly discussed: backend plugin using streams.
In this post, a datasource backend plugin will be created with a frontend and a backend part. We will provide some parameters to the backend that will be used to generate random numbers that will be returned to the frontend. The following image shows a panel using this data source:
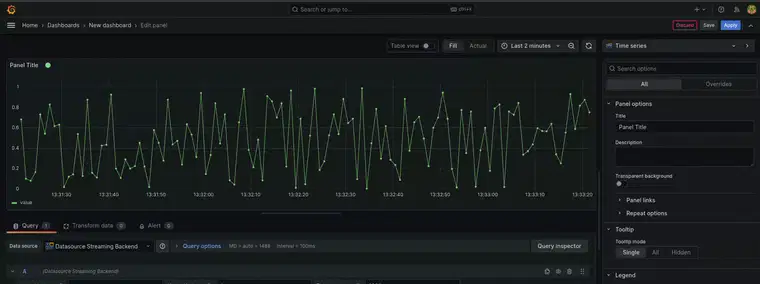
This is a minimal example that you can alter according to your needs: providing different parameters to the query or generating that data in another way, for example. The complete example can be found in this repository: https://github.com/oshirohugo/datasource-streaming-backend.
Please note, that the Grafana tools used in this text are all in continuous change, and some details may differ depending on when you're trying to build your plugin.
Creating the plugin
You can create all the plugin code from scratch, as long as you follow the Grafana plugins specification and implement all the necessary interfaces, but the easiest way to create a plugin is using the @grafana/create-plugin tool. Go to the location where you want your plugin directory to be created and run:
npx @grafana/create-plugin@latest
It will prompt you some questions about your plugin name and type, your organization, and many other options. All the questions can be answered according to your own needs, but - for the current example - the type of the plugin should be datasource and it should have a backend part.
The tool will create a skeleton with all the necessary code and dependencies to run a datasource backend plugin. And, if you compile the code, you will have a very simple backend plugin. However, this generated code isn't a streaming plugin yet and some modifications are necessary.
Plugin Frontend
As we want to pass some parameters to the backend part of the plugin, we first alter /src/components/QueryEditor.tsx. This component defines the inputs that the user can provide to the query. We will add three number inputs, used to generate our data:
-
tickInterval, the interval that the data will be generated; -
upperLimit, the upper limit to the generated random numbers; -
lowerLimit, the lower limit to the generated random numbers.
To accomplish this, replace the QueryEditor function in /src/components/QueryEditor.tsx by the following code:
export function QueryEditor({ query, onChange, onRunQuery }: Props) {
  const onLowerLimitChange = (event: ChangeEvent<HTMLInputElement>) => {
    onChange({ ...query, lowerLimit: event.target.valueAsNumber });
  };

  const onUpperLimitChange = (event: ChangeEvent<HTMLInputElement>) => {
    onChange({ ...query, upperLimit: event.target.valueAsNumber });
  };

  const onTickIntervalChange = (event: ChangeEvent<HTMLInputElement>) => {
    onChange({ ...query, tickInterval: event.target.valueAsNumber });
  };

  const { upperLimit, lowerLimit, tickInterval } = query;

  return (
    <div className="gf-form">
      <InlineField label="Lower Limit" labelWidth={16} tooltip="Random numbers lower limit">
        <Input onChange={onLowerLimitChange} onBlur={onRunQuery} value={lowerLimit || ''} type="number" />
      </InlineField>
      <InlineField label="Upper Limit" labelWidth={16} tooltip="Random numbers upper limit">
        <Input onChange={onUpperLimitChange} onBlur={onRunQuery} value={upperLimit || ''} type="number" />
      </InlineField>
      <InlineField label="Tick interval" labelWidth={16} tooltip="Server tick interval">
        <Input onChange={onTickIntervalChange} onBlur={onRunQuery} value={tickInterval || ''} type="number" />
      </InlineField>
    </div>
  );
}
The next step is to alter src/datasource.ts. This is where the query executed by the frontend part of your plugin is made. It will be modified to query through a stream channel. Then add the following method to DataSource class:
  query(request: DataQueryRequest<MyQuery>): Observable<DataQueryResponse> {
    const observables = request.targets.map((target, index) => {
      const query = defaults(target, DEFAULT_QUERY);

      return getGrafanaLiveSrv().getDataStream({
        addr: {
          scope: LiveChannelScope.DataSource,
          namespace: this.uid,
          path: `my-ws/custom-${query.lowerLimit}-${query.upperLimit}-${query.tickInterval}`, // this will allow each new query to create a new connection
          data: {
            ...query,
          },
        },
      });
    });

    return merge(...observables);
  }
The call to getGrafanaLiveSrv() returns a reference to Grafana backend, and the getDataStream call creates the stream. As shown in this piece of code we need to provide some data to create the stream. Following we detail the meaning of each one:
-
scope: defines how the channel is used and controlled, as it is for a data source we define it as such; -
namespace: is a unique identifier for our specific data source; -
path: is the part that can distinguish between channels created by the same data source. In our case we want to create a different channel for every query, so we will use the query parameters as part of the path; -
data: is used to exchange information between the frontend the the backend.
Note that path doesn't define the channel ID by itself. The stream will be uniquely identified by a combination of some parameters and it will have the format: ${scope}/${namespace}/${path}. This is only an implementation detail and you most probably won't need to know this, unless you are debugging something.
It's also worth mentioning that the path can be used to exchange data with the backend part as well, but for complex formats, use the data property.
Plugin Backend
Now we need to add the necessary code to the backend. For that, we will change pkg/plugin/datasource.go, this is where the backend part responsible for handling the queries created by the frontend is defined. In our case, as we want to handle a stream, we will need to implement the backend.StreamHandler. To enforce this, we will add the following part in the replacement of the var that was provided:
var (
    _ backend.CheckHealthHandler    = (*Datasource)(nil)
    _ instancemgmt.InstanceDisposer = (*Datasource)(nil)
    _ backend.StreamHandler         = (*Datasource)(nil)
)
That means our DataSource will implement backend.CheckHealthHandler, instancemgmt.InstanceDisposer and backend.StreamHandler. The methods necessary for the first two are already provided in the scaffold, therefore we will need to implement only the methods necessary backend.StreamHandler. For that add:
func (d *Datasource) SubscribeStream(context.Context, *backend.SubscribeStreamRequest) (*backend.SubscribeStreamResponse, error) {
    return &backend.SubscribeStreamResponse{
        Status: backend.SubscribeStreamStatusOK,
    }, nil
}
This will be called when the user tries to subscribe to a channel. You can implement permissions checking here, but in our case we just want the user to connect successfully in each attempt, therefore we just return a backend.SubscribeStreamStatusOK.
Next, we need to implement the PublishStream method:
func (d *Datasource) PublishStream(context.Context, *backend.PublishStreamRequest) (*backend.PublishStreamResponse, error) {
    return &backend.PublishStreamResponse{
        Status: backend.PublishStreamStatusPermissionDenied,
    }, nil
}
This will be called whenever a user tries to publish to a channel. As we don't want to receive any data from the frontend after the first connection is created we just return a backend.PublishStreamStatusPermissionDenied
Finally, the most important part, we need to implement the RunStream method:
func (d *Datasource) RunStream(ctx context.Context, req *backend.RunStreamRequest, sender *backend.StreamSender) error {
    q := Query{}
    json.Unmarshal(req.Data, &q)

    s := rand.NewSource(time.Now().UnixNano())
    r := rand.New(s)

    ticker := time.NewTicker(time.Duration(q.TickInterval) * time.Millisecond)
    defer ticker.Stop()

    for {
        select {
        case <-ctx.Done():
            return ctx.Err()
        case <-ticker.C:
            // we generate a random value using the intervals provided by the frontend
            randomValue := r.Float64()*(q.UpperLimit-q.LowerLimit) + q.LowerLimit

            err := sender.SendFrame(
                data.NewFrame(
                    "response",
                    data.NewField("time", nil, []time.Time{time.Now()}),
                    data.NewField("value", nil, []float64{randomValue})),
                data.IncludeAll,
            )

            if err != nil {
                Logger.Error("Failed send frame", "error", err)
            }
        }
    }
}
This method will be called once per connection and this is where we can parse the data sent by the frontend and where we will send the data back continuously. In this specific example, we will use the data sent by the frontend to define the frequency at which we will be sending frames and the range of random numbers generated.
Therefore, in the first part of the method we have the data parsing. Where query is a struct defined as:
type Query struct {
    UpperLimit   float64 `json:"upperLimit"`
    LowerLimit   float64 `json:"lowerLimit"`
    TickInterval float64 `json:"tickInterval"`
}
In our example, we put this code in ./pkg/plugin/query.go.
In the second part, we create a ticker and an infinity loop based on this ticker. Whenever the ticker times out, we will enter the second case of the select, generate a random number randomValue, create a data frame using data.NewFrame, containing the randomValue and the current time, and send it using sender.SendFrame. This will run indefinitely until we close the channel.
You can remove the method QueryData that is created by the scaffold and all the code related to it since we are not implementing the backend.QueryDataHandler anymore.
Set the plugin as streaming
Grafana needs to recognize that the new plugin is a streaming plugin when it's first loaded, to accomplish this, simply add "streaming":true property to your src/plugin.json
{
  ...
  "id": "grafana-streamingbackendexample-datasource",
  "metrics": true,
  "backend": true,
  ...
  "streaming": true
}
Building the plugin
The code part is done. Now we need to generate our plugin package to be able to run it in Grafana. Since our plugin has both a frontend and a backend part, this will be done in two steps. First the frontend:
npm install
npm run build
This should download all the dependencies and create the frontend plugin files in the ./dist directory.
Then we need to compile the backend code and generate the plugin binaries. For that you should have mage installed and then you simply need to run:
mage -v
this will compile the go code and generate binaries for all Grafana-supported platforms also in ./dist.
Running the plugin
Once the plugin build is done, you can copy ./dist together with its content, rename it to the id of your plugin, put it in the plugins path of your Grafana instance, and test it.
However, there is an easier way of doing all this. Since we generate the project structure using plugin-tools we can simply run:
npm run server
This will run a Grafana container using docker-compose and put the built plugins in the right place. Then you can access Grafana at https://localhost:3000.
Note: you may be using docker compose instead of docker-compose, if that is your case, you just need to change the command in the package.json in the project root directory.
Testing the Plugin
The screenshots in this section were taken running Grafana v10.2.1, therefore they may not reflect exactly what you will see when running your example.
First access Grafana at https://localhost:3000. When you're asked for credentials, use the default ones: username admin and password admin. If you're not presented with a login page, click "Sign in" in the right upper corner of the page and insert the previously mentioned credentials.
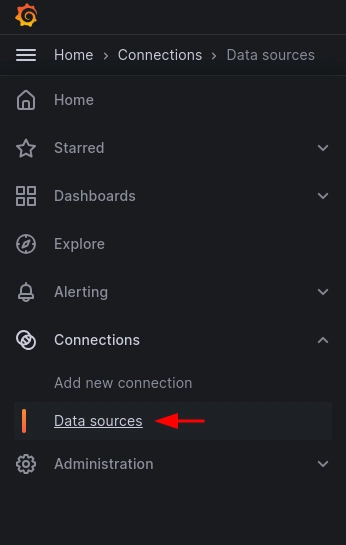
Next, let's add our data source. Since we are running in our docker-compose environment, we don't need to install it, and it will be directly available for usage. Then we need to go to "Connections > Data sources", using the left menu as shown in the following image.
A new page will open and then we need to click the "Add data source" button. It will take us to another page where we can search for the data source name that we've just created. Click on its card. And on the next page click "Save & test"
A randomized error may occur (we didn't alter this part in the code), so just click "Save & test" until a successful message appears.
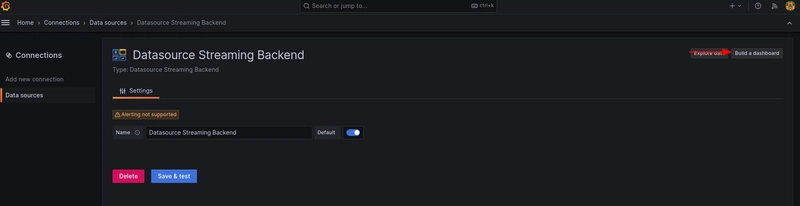
Next, click the "Build a dashboard" button in the right upper corner. It will take you to another page where you should click a button to "+ Add visualization". A new page will appear and when presented with a modal, click the newly added data source. Some data will start being presented.

To visualize it better, change the visualization time range, to something like 1 minute from now and apply it.
After that, you should start seeing data in real-time. You can change the upper and lower limit or the tick interval if you want. This will generate a new query and the panel will be updated. You can also add more queries if you want.

Top comments (0)