
Benchmarking software is a tricky business. For robust results, you need dedicated hardware that only runs the benchmarking suite under controlled conditions. No other processes! No OS updates! Nothing else! Even then, you might find out that CPU throttling, thermal regulation and other issues can introduce noise in your measurements.
So, how are we even trying to do it on a CI provider like GitHub Actions? Every job runs in a separate VM instance with frequent updates and shared resources. It looks like it would just be a very expensive random number generator.
Well, it turns out that there is a sensible way to do it: relative benchmarking. And we know it works because we have been collecting stability data points for several weeks.
Good benchmarking on shared resources?
Speed-critical projects use benchmark suites to track performance over time and detect regressions from commit to commit. For these measurements to be useful, they need to be comparable and hence use the exact same conditions for each data point. Guaranteeing this in absolute manners can be a daunting task, but there are ways around it.
Instead of going through all the complications involved in renting or acquiring dedicated hardware, setting up credentials and monitoring costs, we hoped we could use the same free cloud resources normally used for CI tests. Ideally, GitHub Actions.
Let's compare the requirements for good benchmarks and the features provided by CI services. That way we can understand how to work around some of the apparent limitations:
| A good benchmark suite... | CI services... |
|---|---|
| runs on the same hardware every time | provide a different (standardized) machine for each run |
| runs on dedicated hardware | run on shared resources |
| runs on a frozen OS configuration | update their VM images often |
| requires renting or acquiring such hardware | are free |
| requires authentication mechanisms | implement authentication out of the box |
| requires hardware that can be abused through public PRs | are designed for public PRs |
Looking at that table we see that CI services are attractive because of the cost and setup, but fail to provide some of the essential quality factors for reliable benchmarking. That is, if we want to track performance over time and compare absolute measurements directly.
What if we only want to detect regressions introduced in a PR? Or in the current commit against the last release? We do not need absolute measurements, just a way to compare two commits in a reliable way. This is exactly what we meant by relative benchmarking.
The idea is to run the benchmarking suite in the same CI job for the two commits we are comparing. This way, we guarantee we are using the exact same machine and configuration for both. By doing this, we are essentially canceling out the background noise and can estimate the performance ratio of the two commits.
There are some gotchas, though. Benchmark suites can take long to run, and running them twice makes it even worse. This opens an even larger time window for other CI jobs to pollute our measurements with resource-intensive tasks that happen to be running at the same time. To minimize these effects, benchmarking tools run the tests several times in different schedules and apply some statistics to correct for the inevitable deviations. Or, at least, try.
Relative performance measurements with Airspeed Velocity
scikit-image, the project that commissioned this task, uses Airspeed Velocity, or asv, for their benchmark tests.
asv's main feature is being able to track performance measurements over time in a JSON database and generate beautiful dashboards that can be published to a static site server like GitHub Pages. For an example, look at the reports for pandas at their speed.pydata.org website.
asv also has a special subcommand named continuous, which might provide the functionally we needed. The help message says:
Run a side-by-side comparison of two commits for continuous integration.
This sounds like exactly what we are looking for! Let's break down how it works:
- When we run
asv continuous A B,asvwill create at least two† virtual environments (one per commit) and install revisions A and B in those, respectively. If the project involves compiled libraries (as is the case withscikit-image), this can be a lengthy process! - The default configuration will run the benchmark in two interleaved passes, with several repeats each. In other words,
asvwill run the suite four times (A->B->A->B)! This is done to account for the unavoidable deviations from ideality caused from co-running processes, as mentioned above. - The statistics for each commit are gathered and a report table is presented. The ratio of each test is computed and, if it is greater than a certain threshold (
1.2by default) an error is emitted.
†
asvsupports the notion of a configuration matrix, so you can test your code under different environments; e.g. NumPy versions, Python interpreters, etc.
For the benchmark suite of scikit-image as of June/July 2021, this ends up taking up to two hours. This raises two questions we will answer in the following sections:
- Although we are trying hard to reduce measurement errors, is that enough? Are these measurements reliable?
- Two hours might be too long. Are there any settings we can tune to reduce the runtime without reducing the accuracy of the measurements?
Are CI services reliable enough for benchmarking?
We saw above that CI services are not designed for this kind of task, but with some workarounds they might be good enough. However, how can we be sure? As data-driven scientists, we say let's run an experiment!
The setup
If our experiment is data-driven, we should generate some data first. This is our strategy:
- We will benchmark and compare two commits that are exactly the same in terms of tested code.
- Under ideal conditions, we should see that the performance ratio between the two commits is
1.0. In other words, performance should be the same. Of course, these are not ideal conditions, so some kind of error is expected. We just want it to stay reliably under an acceptable threshold. - We will implement a GitHub Actions workflow that will run every six hours (four times a day) and collect results for a week or more. This will help us account for two things:
- Accumulate sufficient data points to answer our question.
- Account for time factors like different days of the week (e.g. weekday vs weekend), or the time of the day (3am vs 3pm).
- The workflow will upload the benchmark results as artifacts we can download and process locally with a Jupyter Notebook.
Check the GitHub Actions workflow in this fork!
The results
To measure the stability of the different benchmark runs we will be looking at the performance ratio of the measurements between the two commits. Since they are identical in terms of tested code, ideally they should be all 1.0. We know this will not happen, but maybe the errors are not that big and stay like that regardless the time of the day or the day of the week.
After collecting data points for 16 days, these are the results:

- Average time taken: 1h55min
- Minimum and maximum ratios observed: 0.51, 1.36
- Mean and standard deviation of ratios: 1.00, 0.05
- Proportion of false positives: 4/108 = 3.7%
In the X axis you can see the different runs, sorted by date and time. Days of the week are grouped with colored patches for easier visual analysis. In the Y axis, we plot the performance ratio. Each of those vertical clouds include 75 points, one per benchmark test. Ideally, they should all fall at y=1. Of course, not all of them are there, but a surprising amount of them do!
But! We do see some bigger deviations at certain times! How is that possible? Well, that's the error we were talking about! These outliers are the ones that would concern us because they can be interpreted as false positives. In other words: asv would report a performance regression, when in fact there's none. However, in the observed measurements, the outliers were always within y ∈ (0.5, 1.4). That means we can affirm that the method is sensitive enough to detect performance regressions of 50% or more! This is good enough for our project and, in fact, some projects might even be happy with a threshold of 2.0.
If you are curious about how we automatically downloaded the artifacts, parsed the output, and plotted the performance ratios, check the Jupyter Notebook here.
Can we make it run faster without losing accuracy?
We just found out that this approach is sensitive enough but it takes two hours to run. Is it possible to reduce that time without sacrificing sensitivity? We need to remember that asv is running several passes and repeats to reduce the measurement error, but maybe some of those default counter-measures are not needed. Namely:
-
The benchmark runs with
--interleave-processes, but it can be disabled with--no-interleave-processes. The help message for this flag says:Interleave benchmarks with multiple processes across commits. This can avoid measurement biases from commit ordering, can take longer.
How much longer? Does it help keep error under control? We should measure that.
By default, all tests are run several times, with different schedules. There are two benchmark attributes that govern these settings:
processesandrepeat.processesdefaults to2, which means that the full suite will be run twice per commit. If we only do one pass (processes=1), we will reduce the running time in half, but will we lose too much accuracy?
To answer both questions, we added more entries to the data collection workflow shown above by parameterizing the asv command-line options.
These are the results!
No process interleaving
Disabling process interleaving should be faster and maybe the accuracy loss is not that bad. But... how bad? Here are the results:
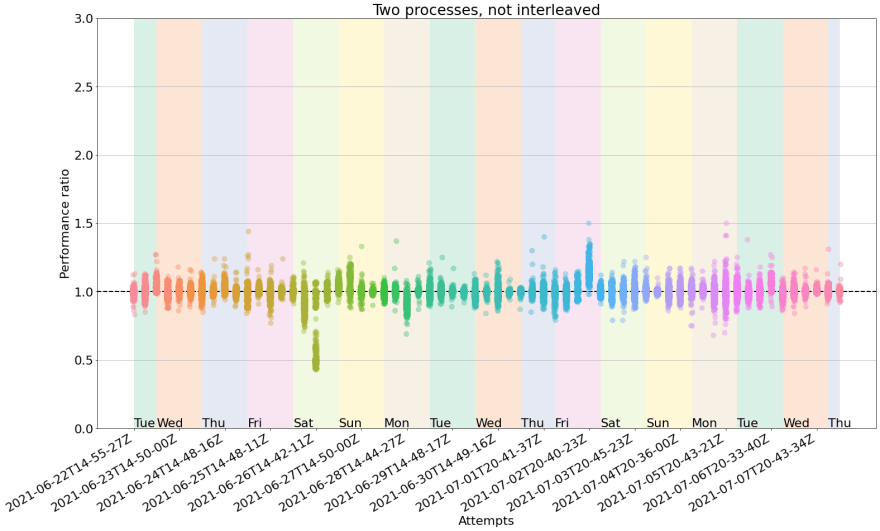
- Average time taken: 1h39min
- Minimum and maximum ratios observed: 0.43, 1.5
- Mean and standard deviation of ratios: 0.99, 0.07
- Proportion of false positives: 6/66 = 9.99%
Single-pass with processes=1
In this configuration, we expect a drastic 50% running time reduction, since we will only do one pass per commit, instead of two. However, the accuracy loss might be too dramatic... Let's see!

- Average time taken: 1h7min
- Minimum and maximum ratios observed: 0.51, 2.76
- Mean and standard deviation of ratios: 1.01, 0.07
- Proportion of false positives: 8/64 = 12.5%
At first sight, those clouds look very spread! The number of false positives is also larger.
Summary of the strategies
Let's take a look at the three strategies now. The main columns are runtime and %FP (percentage of false positives). We want the smallest %FP at the shortest runtime.
| Strategy | Runtime | %FP | Min | Max | Mean | Std |
|---|---|---|---|---|---|---|
| Default | 1h55 | 3.7 | 0.51 | 1.36 | 1.00 | 0.05 |
| No interleaving | 1h39 | 9.99 | 0.43 | 1.50 | 0.99 | 0.07 |
| Single pass | 1h07 | 12.5 | 0.51 | 2.76 | 1.01 | 0.07 |
Unsurprisingly, the default strategy (two passes, interleaved) is the most accurate, but also the most time consuming. Disabling process interleaving helps reduce the average runtime 16min but the false positives increased to more than double! Using a single pass brought the runtime down to an hour, but multiplied the false positives by almost four.
In short, we will stick to the default strategy for accuracy but need to investigate other ways to make it run in less time.
We also considered running several single-pass replicas in parallel using different GitHub Actions jobs. In theory, a false positive could be spotted by comparing the values of the failing tests in the other replicas. Only true positives would reliably appear in all replicas. However, this consumes more CI resources (compilation happens several times) and is noisier from the maintainer perspective, who would need to check all replicas. Not to mention that more replicas increase the chances for more false positives!
Speeding up compilation times
So far we have only looked at speeding up the benchmark suite itself, but we saw earlier that asv will also spend some time setting up virtual environments and installing the project. Since installing scikit-learn involves compiling some extensions, this can add up to a non-trivial amount of time.
To accelerate the creation of the virtual environments, which in our case uses conda, we replaced the conda calls with a faster implementation called mamba. We rely on an asv implementation detail: to find conda, asv will first check the value of the CONDA_EXE environment variable. This is normally set by conda activate <env>, but we overwrite it with the path to mamba to have asv use it instead.
The second optimization is leveraging the use of a compiler cache. Since most of the modules will not change in a given PR, we can use ccache to keep the unchanged libraries around. Check the workflow file to see how it can be implemented on GitHub Actions.
These two changes together brought the average running time down to around 1h 20min. Not bad!
Run it on demand!
Benchmarks do not need to run for every single commit pushed to a PR. In fact, that's probably a waste of resources. Instead, we'd like the maintainers to run the benchmarks on demand, whenever needed during the PR lifetime.
GitHub Actions offers different kinds of events that will trigger a worklow. By default the on.pull_request trigger is configured to act on three event types: [opened, reopened, synchronize]. In practice, this means after every push or after closing+opening the PR. However, there are more triggers!
Of all the choices, we settled for labeled. This means that the workflow will be triggered whenever the PR is tagged with a label. To specify which label(s) are able to trigger the workflow, you can use an if clause at the job level, like this:
name: Benchmark

on:
  pull_request:
    types: [labeled]

jobs:
  benchmark:
    if: ${{ github.event.label.name == 'run-benchmark' && github.event_name == 'pull_request' }}
    name: Linux
    runs-on: ubuntu-20.04
    ...
In this example, the PR will only get triggered if the label is named run-benchmark. This works surprisingly well as a manual trigger! It is also restricted to authorized users (triaging permissions or above), so no need to fiddle with authentication tokens or similar complications.
There is one gotcha, though: the checks UI will be appended to the last push event panel, which can be confusing if more commits have been added to the PR since the label was added. Ideally, the checks UI panel would be added next to the @user added the run-benchmark label message. Maybe in a future update?
TLDR
We have seen that GitHub Actions is indeed good enough to perform relative benchmarking in a reliable way as long as several passes are averaged together (default behaviour in asv continuous). This takes a bit more time but you can speed it up a bit with mamba and ccache for compiled libraries. Even in that case, it is probably overkill to run it for every push event, so we are using the on.pull_request.labeled trigger to let the maintainers decide when to do it on demand.
Useful references
- scikit-image/scikit-image #5424: The PR where all this was implemented.
- Analysis notebook: The code used to analyze the benchmarking data.
-
asv.readthedocs.io: The official documentation for
asv. - Building an Open Source, Continuous Benchmark System
- Conbench: Language-independent Continuous Benchmarking Tool, by Ursa Labs
- PyPy Speed
- Pandas Speed
Acknowledgements
Thanks Gregory Lee, Stéfan van der Walt and Juan Nunez-Iglesias for their enthusiastic and useful feedback in the PR! The plots look that pretty thanks to comments provided by John Lee. Gregory Lee, Gonzalo Peña-Castellanos and Isabela Presedo-Floyd provided super valuable comments and suggestions for this post.
This work was funded by the Chan-Zuckerberg Institute (CZI) as part of an Essential Open Source Software for Science grant.

Latest comments (0)