
Heat maps are a popular way to represent data where each entity is associated with some intensity or magnitude. This article serves as a guide to making heat maps for spatial data using Google Maps for Android.
Note: This blog expects you to know how to setup Google Maps in Android. If you are not aware of the same, check out the official guide by Google. This article uses Kotlin language for all Android code.
Source code of this project is available on my GitHub.
Basics of heatmaps
Heat maps are way of representing data having some magnitude using colours, and are quite popular in showing spatial data.
A common example of heat maps in real life is temperature charts.

Understanding the data structure
In order to show as a heat map, data is stored as a collection of objects having a latitude, longitude and intensity value. The easiest way to do this is to store them as a JSON array of objects each having latitude, longitude and intensity fields. An example is given below.
[
    {
        "intensity": 213.0,
        "lat": 14.68365,
        "lon": 77.58146
    },
    {
        "intensity": 275.0,
        "lat": 13.20588,
        "lon": 79.08805
    },
    {
        "intensity": 477.0,
        "lat": 16.96423,
        "lon": 82.23792
    }
]
Building heatmaps using Google Maps
For the sake this article, we will be showing a heat map of district-wise population density of India, represented as the number of people per square kilometre. I have already compiled the data as a JSON file, which we will be using later on to load our heatmap data. You can get a copy of the JSON file here.
While the basic Google Maps SDK does not contain any heat map utilities, Google has provided an extension library, called the Google Maps Utility Library, which adds complex features to your existing Google Maps setup.
Add dependencies
Add the following gradle dependencies in your app module build.gradle. You might already have the Google Maps dependency added while you were setting up Google Maps in your project.
implementation 'com.google.maps.android:android-maps-utils:1.0.2'
implementation 'com.google.android.gms:play-services-maps:17.0.0'
Load heatmap data from assets
In real life projects, spatial data is usually fetched from the server in real time. However, to reduce complexity for the sake of this example, we’ll be loading the data from a local JSON file.
In case you missed it, you can download the JSON file here
First, let’s set up our assets folder. Switch to Project view and in the app > src > main directory create a new directory called assets. Paste the downloaded JSON file in this assets folder.

With the file in place, we’ll now read the file contents in our Android code. Our JSON file contains an array of objects, each having the following structure:
{
    "density": 123.4,
    "lat": 18.5544,
    "lon": 76.3324
}
In MainActivity, we’ll create a function called getJsonDataFromAsset which will read the file and retrieve its contents as a JSON array.
private fun getJsonDataFromAsset(fileName: String): JSONArray? {
        try {
            val jsonString = assets.open(fileName).bufferedReader().use { it.readText() }
            return JSONArray(jsonString)
        } catch (e: Exception) {
            e.printStackTrace()
            return null
        }
}
Displaying the heatmap
So far, we have our data as a JSON array. Great! But how do we use it? This is where Google Maps Utility library comes into the picture. The library has components that enable us to easily make heatmaps. One of them is the WeightedLatLng class, which can store latitude, longitude and the weight (intensity).
The Google Maps heat map overlay will expect an ArrayList of WeightedLatLng objects, so let’s generate one from our JSON data. We’ll write a function called getHeatMapData which will parse our JSON array and return us an ArrayList of WeightedLatLng objects.
private fun generateHeatMapData(): ArrayList<WeightedLatLng> {
        val data = ArrayList<WeightedLatLng>()

        // call our function which gets json data from our asset file
        val jsonData = getJsonDataFromAsset("district_data.json")

        // ensure null safety with let call
        jsonData?.let {
            // loop over each json object
            for (i in 0 until it.length()) {
                // parse each json object
                val entry = it.getJSONObject(i)
                val lat = entry.getDouble("lat")
                val lon = entry.getDouble("lon")
                val density = entry.getDouble("density")

                // optional: remove edge cases like 0 population density values
                if (density != 0.0) {
                    val weightedLatLng = WeightedLatLng(LatLng(lat, lon), density)
                    data.add(weightedLatLng)
                }
            }
        }

        return data
}
Now, in the overridden onMapReady function, we can write our code to generate our heat map. Let’s first generate our data by calling the generateHeatMapData function as follows.
val data = generateHeatMapData()
After that, we’ll be creating a HeatMapTileProvider object using its builder.
val heatMapProvider = HeatmapTileProvider.Builder()
            .weightedData(data) // load our weighted data
            .radius(50) // optional, in pixels, can be anything between 20 and 50
            .build()
Finally, we’ll center Google Map over India (i.e. wherever our data is) so that we are able to see the heatmap.
val indiaLatLng = LatLng(20.5937, 78.9629)
googleMap?.moveCamera(CameraUpdateFactory.newLatLngZoom(indiaLatLng, 5f))
That’s it! Here’s the entirety of onMapReady function for your reference.
override fun onMapReady(googleMap: GoogleMap?) {
    val data = generateHeatMapData()

    val heatMapProvider = HeatmapTileProvider.Builder()
        .weightedData(data) // load our weighted data
        .radius(50) // optional, in pixels, can be anything between 20 and 50
        .build()

    googleMap?.addTileOverlay(TileOverlayOptions().tileProvider(heatMapProvider))

    val indiaLatLng = LatLng(20.5937, 78.9629)
    googleMap?.moveCamera(CameraUpdateFactory.newLatLngZoom(indiaLatLng, 5f))
}
Let’s run the project and see how our map looks.

That worked! But hey, why is the map so empty? Weren’t you expecting the map to light up? After all, India's population density is one of the highest in the world!
Well, here’s what happened. In places like Delhi, the population density goes to a whopping 36000 per square kilometre. Now consider a city like Bangalore which has a density of 4300 according to our data – although 4300 is a large value, it is nothing as compared to the density in Delhi. In other words, the relatively large value is shadowed by a gigantic other, and is hence considered a small value by the heatmap utility when plotting on the map.
To overcome this, we have the ability to set a maximum intensity for the heat map when creating the heat map tile provider.
val heatMapProvider = HeatmapTileProvider.Builder()
    .weightedData(data) // load our weighted data
    .radius(50) // optional, in pixels, can be anything between 20 and 50
    .maxIntensity(1000.0) // set the maximum intensity
    .build()
Here, setting the maximum intensity overrides the global maximum, i.e. the highest intensity value in our data set, and sets it to whatever value we pass. Let’s try running our project again.
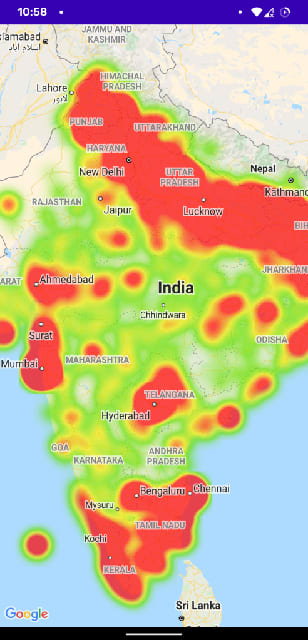
This seems perfect, doesn’t it? Congratulations, you just built your first heat map on Android!
Customizing the Heatmap
You can style your heat map according to your requirements.
You can change the display colors by passing a Gradient to the tile provider builder.
// Create the gradient with whatever start and end colors you wish to use
int[] colors = {Color.GREEN, Color.parseColor("#FF0000")};
float[] startPoints = {0.2f, 1f};
Gradient gradient = new Gradient(colors, startPoints);

val heatMapProvider = HeatmapTileProvider.Builder()
    .weightedData(data)
    .radius(50)
    .maxIntensity(1000.0)
    .gradient(gradient) // set gradient
    .build()
You can also change the opacity of your heat map layer by passing in a value between 0 and 1 to the tile provider builder. This can be particularly helpful if you wish the map in the background to be legible in dark colors.
val heatMapProvider = HeatmapTileProvider.Builder()
    .weightedData(data)
    .opacity(0.5) // set opacity, default is 0.7
    .build()
Final Thoughts
Heat maps can be particularly useful if you wish to represent spatial data having some intensity associated with it. Hopefully this article proves to be the stepping stone for you if you are looking for a career in cartography in mobile applications. As always, I’ll be glad to answer all your questions in the comments section. Keep coding!

Latest comments (1)
top post. nice