
We will go through a tutorial where Python and Flask will be used. However, you will soon realize that Python and Flask are the less important parts here. Due to the nature of the setup (a docker-compose file) you shouldn't have any trouble swapping the Docker for my Flask app with whatever else you want to monitor.
So, what are we actually doing here? What is the final goal?

We will create docker compose file which will instantiate the following services:
- A web app of your own that you want to monitor
- An instance of Telegraf, which is a tool that can send all sorts of metrics about your app's performance to a database.
- An instance of InfluxDB, which is the database where all the Telegraf info will go to, and also where you will write your own metrics from your application.
- Grafana, which will serve to create an awesome dashboard and display all that information.
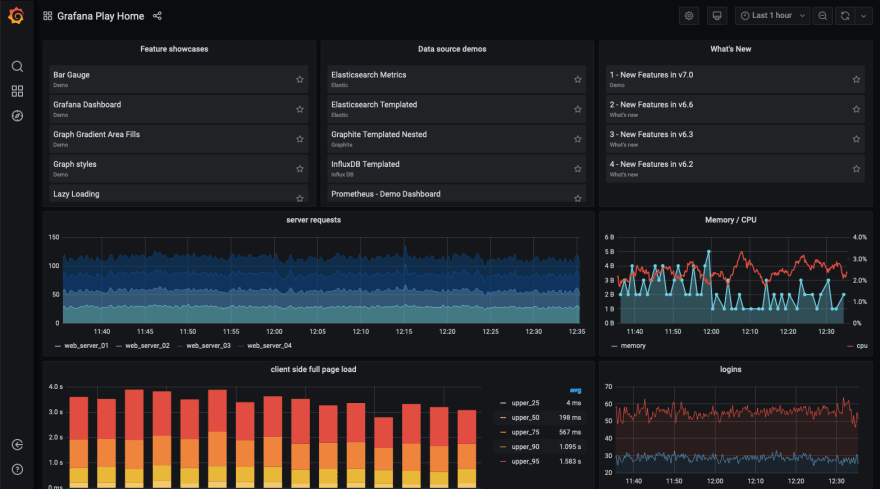
Look at the power of Grafana by visiting their demo here
The duo Telegraf/InfluxDB might get confusing. You could consider that Telegraf will record into InfluxDB data about your performance (cpu usage, memory usage, etc...) But if you want to record things related to the content of your app (requests made to a certain endpoint, how many times a function has been called, how many times it throws an error...) you need to actively save that into InfluxDB from your application. We will see how.
Getting Started
You may clone my repo if you want to follow this easier, or build it yourself as we go:
https://github.com/rubenwap/metrics-stack
Setting up the project
Your app
Go to the folder that contains the app you want to use for this (or look at the cloned repo). The important thing is that you should have a working Dockerfile that if you run it, it launches your app standalone.
Now go ahead and create an empty docker-compose.yaml file.
version: "3"
services:
    metricsweb:
        container_name: metricsweb
        build: .
        ports:
        - 5000:5000
        depends_on:
        - influxdb
As you see, we start by adding one service: Our app. In my case, it's a Flask app, so I am opening the port 5000. This service depends on the future service influxdb. Notice the build parameter. For it to work, you need to have a Dockerfile in the same directory. Mine looks like this:
FROM python:3.7.4-slim-stretch
COPY . /app
WORKDIR /app
EXPOSE 5000
RUN pip install -r requirements.txt
ENTRYPOINT python /app/main.py
Grafana
Grafana is an open source analytics and visualizations solution which is compatible with a lot of databases. In this example we are using InfluxDB since it's really quick and optimized to store time series data, but for example you make Grafana read from your SQL database.
For more information, visit their website
This is the relevant bit you need to add in the docker-compose:
    grafana:
        container_name: grafana
        image: grafana/grafana:latest
        ports:
        - 3000:3000
        volumes:
            - ./grafana/data:/var/lib/grafana
Pretty straightforward. Grafana uses the port 3000 for the web app. We will configure this later.
InfluxDB
Take a look at the Influx website so you will get an idea about its features. In order to add it to our stack, we need this additional piece inside our docker-compose file:
    influxdb:
        container_name: influxdb
        image: influxdb:latest
        ports:
        - 8086:8086
        env_file:
            - 'env.influxdb'
        volumes:
            - ./influxdb/data:/var/lib/influxdb
Some important things:
- I am mounting a local directory volume to store the data. This is so data persist even if you destroy the stack and recreate it again (I did the same with Grafana in the previous step)
- I am reading some variables from an env file. You could also insert them straight into the yaml file, it makes no difference. The most important variable is
INFLUX_DB, which tells you the name of the DB that will be created when the stack goes up. Here is the file I am using:
INFLUXDB_DATA_ENGINE=tsm1
INFLUXDB_REPORTING_DISABLED=false
INFLUX_DB=metrics
INFLUXDB_USER=admin
INFLUXDB_ADMIN_ENABLED=true
Telegraf
Telegraf is made by the same company that makes InfluxDB. You can read more about that here It's a server agent with a lot of plugins that can connect to InfluxDB and store many metrics about your application: CPU usage, memory usage, etc... You can definitely extend what it can detect.
This is the relevant docker-compose bit:
telegraf:
        container_name: telegraf
        image: telegraf
        container_name: telegraf
        restart: always
        depends_on:
        - influxdb
        environment:
            HOST_PROC: /rootfs/proc
            HOST_SYS: /rootfs/sys
            HOST_ETC: /rootfs/etc
        volumes:
            - ./telegraf.conf:/etc/telegraf/telegraf.conf:ro
            - /var/run/docker.sock:/var/run/docker.sock:ro
            - /sys:/rootfs/sys:ro
            - /proc:/rootfs/proc:ro
            - /etc:/rootfs/etc:ro
Notice that besides the volumes that we mount to have persisting data, we have some environment variables telling Telegraf where to get certain information about processes and system.
For the volumes part to work, you will need to create a telegraf.conf file in your local directory with some settings. Here you can see the contents. It's pretty basic and surely it can be improved.
To summarize, here is the full docker-compose.yaml that you will need:
https://github.com/rubenwap/metrics-stack/blob/master/docker-compose.yml
Add code for your metrics
You are ALMOST done. If we would bring up the stack right now, everything would work fine, except the fact that your application wouldn't be sending anything to Influx and you would only have access to system data. Let's add something:
Consider that I only have a main.py file which is a very simple Flask web app, this is what I have:
from flask import Flask
from datetime import datetime
from influxdb import InfluxDBClient


client = InfluxDBClient('influxdb', 8086, 'admin', 'admin', 'metrics')
app = Flask(__name__)

@app.route("/hello")
def hello():
    client.write_points([{
        "measurement": "endpoint_request",
        "tags": {
            "endpoint": "/hello",
        },
        "time": datetime.now(),
        "fields": {
            "value": 1
        }
    }])
    return "Hello World!"


@app.route("/bye")
def bye():
    client.write_points([{
        "measurement": "endpoint_request",
        "tags": {
            "endpoint": "/bye",
        },
        "time": datetime.now(),
        "fields": {
            "value": 1
        }
    }])
    return "Bye World!"

if __name__ == "__main__":
    app.run (host="0.0.0.0")
See how we first initialize a client for the database with the proper parameters, and then on each endpoint, we call the method to write into the database with the relevant content. I have chosen to record a "1" every time the endpoint is called, so later I can visualize that in the dashboard by requesting the sum of that field. Not the only way to do this, but just one way.
Up and running
Build with docker-compose
Run this in your console to bring the stack up:
docker-compose up --build
(to bring it up later on, omit the build argument if you don't have anything new to rebuild)
Your stack would now run on interactive mode (you will see the logging appearing in your console). You can stop it by pressing Ctrl+C. However, by doing so the stack doesn't fully go down. You would then need to do
docker-compose down
If you want to launch it detached from the console, do
docker-compose up -d
Configuring the dashboard
Ok, so your stack is up and running. Make some calls to your api endpoints so it registers some visits and there is some data recorded in the database. Then open Grafana by going to http://localhost:3000
How to use Grafana
After login (admin/admin), first thing you need to do is to add a data source:


You need to configure InfluxDB using influxdb as a host name, because that is the name of the service in the docker compose file. Otherwise we would need to inspect the container to find the internal Docker IP address and that's more convoluted because it can change. Using influxdb to autodiscover the current IP will save us the trouble.
Create a new dashboard...

And you are ready to add new panels. For this example I am going to add the percentage of idle CPU. I have this data courtesy of Telegraf. Since this is a trivial app, you will see that the percentage is huge, because I am doing nearly nothing with this app:
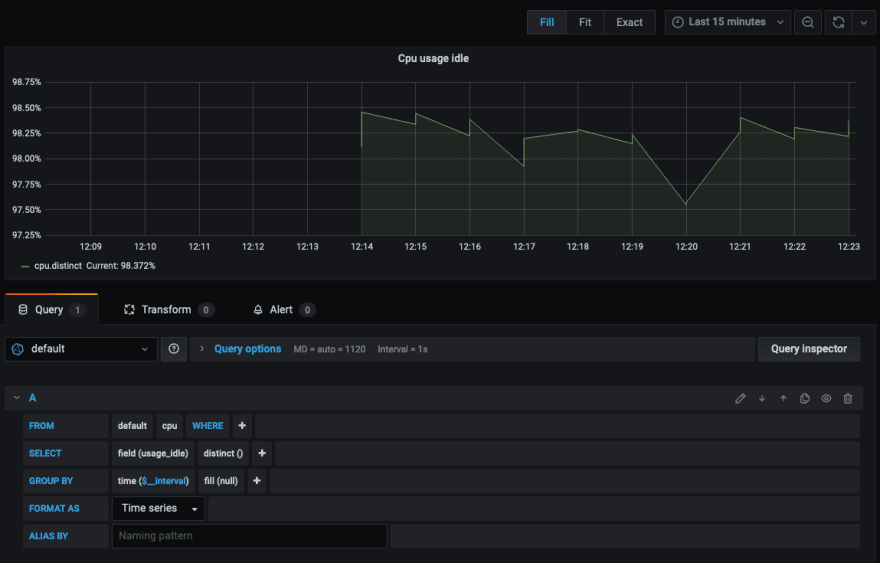
If you click on the lower part of the screen, in the query builder, you can select your FROM (in this example we only have one database) and that should autopopulate the dropdown menus with the available selections.
Look at this other panel. This creates a counter of the amount of times /hello has been visited. This data comes from the influxdb code that we have put into our Python app

Look how endpoint_request appears in the dropdown, since that is the key we are saving from our code. Then you can choose what to do with this data. In my case I present the sum of all entries in a counter.
As you see, Grafana is a really cool and comprehensive tool. I recommend you to play around building panels for different metrics. It's really powerful!
I hope you could find some use from this tutorial. Grafana and Influx are also a new subject for me, so if you have any tips or comments, let me know!

Oldest comments (0)