Hello!
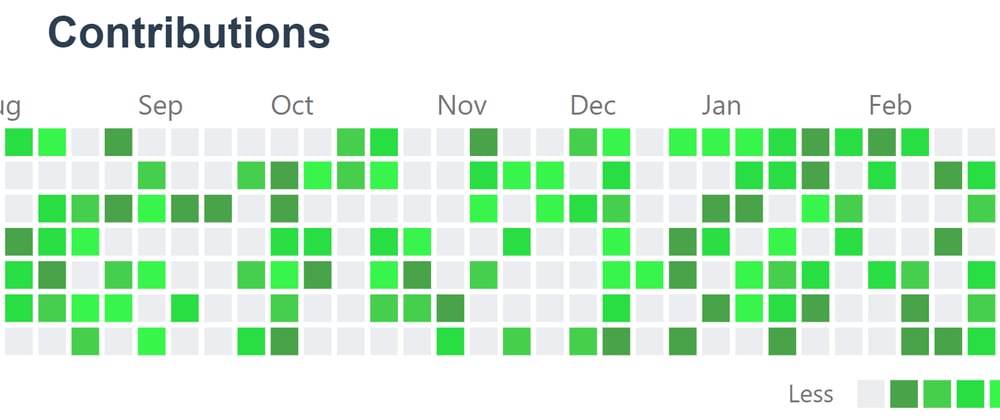
In this article, I will show you a nice tool which help you make a contributions graph like github in your application and basic and optional usage of it.
About Tools
The tool I show is vue-calendar-heatmap.
It not only provides SVG data which contains a contributions graph, but enables you to customize graphs .
Next, I will show basic and optional usage of it.
warning
I used it in only vue2 so I don't know whether it can work correctly in vue3
Basic Usage
Basic usage scripts of it are
<calendar-heatmap :values="[{ date: '', count: }, ...]" end-date=""/>
date = date you want to paint
count = count in the date
end-date = last date of the graph.
If you want to make a graph which contains count 3 in 2021/09/22 and count 6 in 2022/01/11, scripts are
<calendar-heatmap :values="[{ date: '2021-9-22', count: 3 },{date: '2022-1-11', count: 6}]" :end-date="Date()"></calendar-heatmap>
// Date() is 2022/02/18
and the output is
warning
It can show only count in date within one year ofend-date.
Optional Usage
change color of count
:range-color enables you to change color of count.
If you want to use yellow, scripts are
<calendar-heatmap
:values="[{ date: '2021-9-22', count: 3 }, {date: '2022-1-11', count: 6}]"
:end-date="2022/02/18"
:range-color="[
  '#ebedf0',
  'rgba(255,202,43,0.4)',
  'rgba(255,202,43,0.6)',
  'rgba(255,202,43,0.8)',
  'rgba(255,202,43,1.0)',
]"></calendar-heatmap>
and output is
change color gradation
In default setting, color of count which is more than 5 is the deepest ( In other words, :range-color[4]) but if you set :max , you can change color gradation according to count.
If you set :max = 10,
<calendar-heatmap :values="[{ date: '2021-9-22', count: 3 }, {date: '2022-1-11', count: 6}]" :end-date="Date()" :max="10"></calendar-heatmap>
the output is
nothing when hovering graphs
If you set :tooltip = "false", there are nothing when hovering graphs.
<calendar-heatmap :values="[]" :end-date="Date()" :tooltip="false"></calendar-heatmap>
change units
tooltip-unit enable you to change units which are displayed when hovering graphs. (default units is contributions)
If you want to change units, scripts are
<calendar-heatmap :values="[{ date: '2021-9-22', count: 3 }, {date: '2022-1-11', count: 6}]" :end-date="Date()" tooltip-unit="こんとりびゅーと"></calendar-heatmap>
// こんとりびゅーと is Japanese word meaning contribution.
output is
change direction
If you set :vertical="true", you can make graphs vertical.
<calendar-heatmap :values="[{ date: '2021-9-22', count: 3 }, {date: '2022-1-11', count: 6}]" :end-date="Date()" :vertical="true"></calendar-heatmap>
output is


Top comments (0)