
This tutorial was originally posted on SigNoz Blog and is written by Ricardo Paiva
OpenTelemetry can be used to instrument your Elixir applications to generate telemetry data. The telemetry data can then be visualized using an observability tool to monitor your Elixir application performance. In this tutorial, we will use OpenTelemetry Elixir libraries to instrument an Elixir application and then visualize it using SigNoz.
Somewhere during the lifetime of an application, it's inevitable that it will have some performance issues. If you have set up observability for your applications, it can help you figure out those performance issues quickly.
Introduction
For cloud-native applications, OpenTelemetry provides a framework to set up observability. It consists of a collection of tools, APIs, and SDKs that you can use to instrument, generate, collect, and export telemetry data for analysis in order to understand your software's performance and behavior.
In this tutorial, we'll show you how to monitor your Elixir application using OpenTelemetry and Signoz. We'll focus on the most common and basic Elixir combo: Phoenix + Ecto.
Once everything is installed and configured, you'll be able to see how much time your endpoints and database operations are taking. The collected data, when visualized by a backend tool like SigNoz will help you to troubleshot problems, identify bottlenecks and also find usage patterns that will help you improve your application pro-actively.
OpenTelemetry and SigNoz
OpenTelemetry libraries can only enable the generation of telemetry data. You need a backend that takes in the data for storage and visualization. SigNoz is a full-stack open-source APM tool that can be used for storing and visualizing the telemetry data collected with OpenTelemetry. It is built natively on OpenTelemetry and works on the OTLP data formats.
SigNoz provides query and visualization capabilities for the end-user and comes with out-of-box charts for application metrics and traces.
Now let’s get down to how to implement OpenTelemetry in your Elixir application.
Installing SigNoz
First, you need to install SigNoz so that OpenTelemetry can send the data to it.
SigNoz can be installed on macOS or Linux computers in just three steps by using a simple install script.
The install script automatically installs Docker Engine on Linux. However, on macOS, you must manually install Docker Engine before running the install script.
git clone -b main https://github.com/SigNoz/signoz.git
cd signoz/deploy/
./install.sh
You can visit our documentation for instructions on how to install SigNoz using Docker Swarm and Helm Charts.

When you are done installing SigNoz, you can access the UI at http://localhost:3301
Instrumenting an Elixir Phoenix application with OpenTelemetry
We’ll focus on instrumenting one of the most common combos of the Elixir world: Phoenix + Ecto.
Step 1: Add the required dependencies
The first step to instrument your Elixir application with OpenTelemetry is to add the required dependencies to your mix.exs file and fetch them with mix deps.get
{:opentelemetry, "~> 1.0.3"},
{:opentelemetry_exporter, "~> 1.0.3"},
{:opentelemetry_phoenix, "~> 1.0.0"},
{:opentelemetry_ecto, "~> 1.0.0"}
Step 2: Configure the Elixir application to export telemetry data
Then we need to configure our application to export telemetry data. There are two things that you need to set:
-
YOUR_APP_NAMEYou can put your application or service name here for identification. -
OTEL Collector endpointThe OTEL collector comes bundled with SigNoz installation. Since, we installed SigNoz on our local machine, the endpoint ishttp://localhost:4318.
config :opentelemetry, :resource, service: %{name: "YOUR_APP_NAME"}

config :opentelemetry, :processors,
  otel_batch_processor: %{
    exporter: {
      :opentelemetry_exporter,
      %{endpoints: ["http://localhost:4318"]}
    }
  }
Step 3: Initialize telemetry handlers
As it is documented in the opentelemetry_phoenix and opentelemetry_ecto hexdocs.pm pages, we need to initialize both telemetry handlers.
OpentelemetryPhoenix.setup()
OpentelemetryEcto.setup([:your_app_name, :repo])
:your_app_name should be replaced by your app name and congratulations, you have instrumented your application with OpenTelemetry.
Monitor your Elixir application with Signoz
You can now monitor your Elixir application with SigNoz. Whether you’re using a Phoenix to create REST APIs or HTML applications, you need to generate some data by interacting with your application.
In this GitHub repository you’ll find an Elixir Phoenix API that exposes a couple of endpoints but we’ll focus on one: /api/users that will return a list of users that are stored on the respective database table.
If you want to use this sample application, please refer to the README file in the repository in order to make it run locally.
Now, let’s do a couple of calls to one of the endpoints.
curl http://localhost:4000/api/users
This should generate some telemetry data, which would be exported to SigNoz OTEL collector.
You can access SigNoz UI at http://localhost:3301/application (after signing up) to see your Elixir Phoenix API being monitored. The other applications that you see are sample applications that come bundled with the installation.
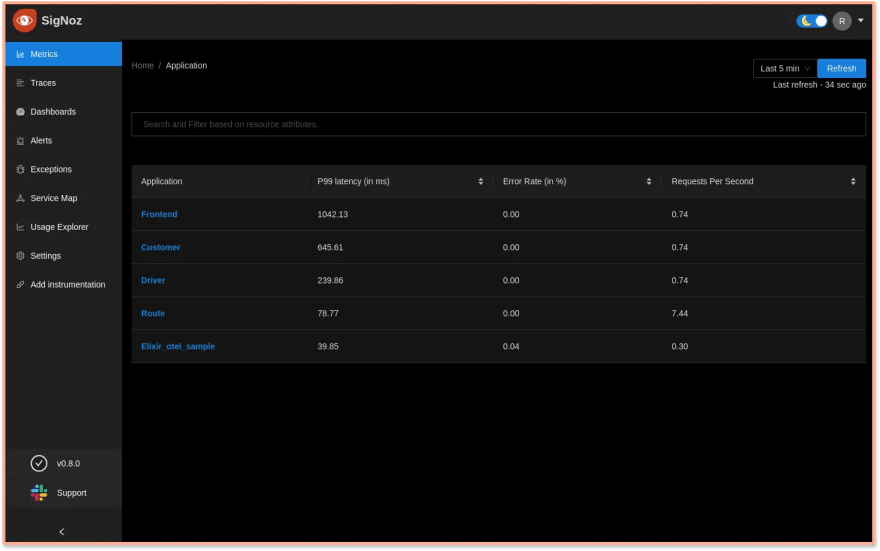
Monitor application metrics of your Elixir app
SigNoz provides out-of-box charts for application metrics like latency, requests per sec, error percentage, etc.

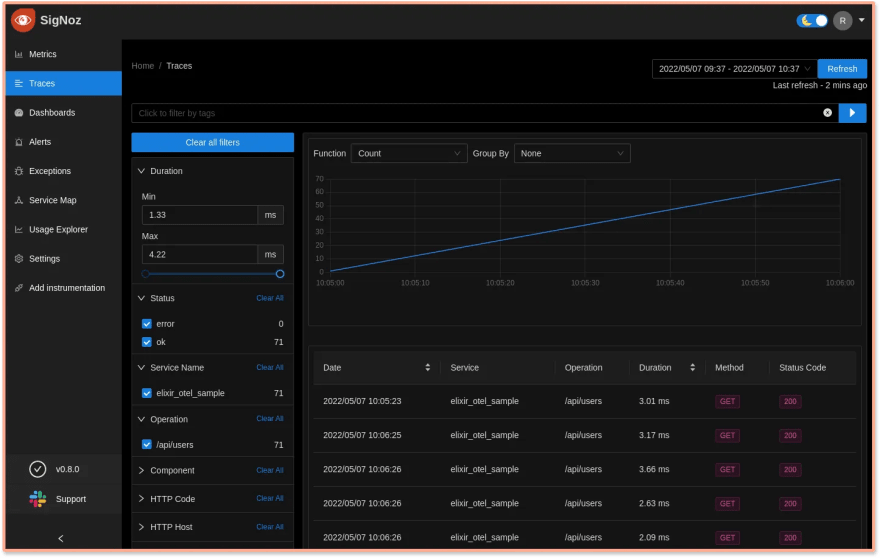
Analyze your tracing data with the Traces tab
Your application metrics are also seamlessly correlated with tracing data. You can choose any timestamp or endpoint to explore Traces during that duration.
Complete breakdown of requests
You can see a complete breakdown of the request with Flamegraphs and Gantt charts. You can click on any span in the spans table to access it.
From our Elixir application, we can see a trace consisting of two spans. The parent one corresponds to the HTTP request and the second one corresponds to the database call.

Troubleshooting an error
SigNoz can also help in troubleshooting errors with error monitoring.
For this, we’ll have to force an error and we can do this by doing the following request:
curl http://localhost:4000/api/users/something
This will cause an error because this endpoint is expecting an integer and not a string
You can go to http://localhost:3301/errors to check out the errors in your application.

If you click on the error, you’ll see some more details about the error and even the stack trace.

Conclusion
Using OpenTelemetry libraries, you can instrument your Elixir applications for setting up observability. You can then use an open-source APM tool like SigNoz to ensure the smooth performance of your Elixir applications.
OpenTelemetry is the future for setting up observability for cloud-native apps. It is backed by a huge community and covers a wide variety of technology and frameworks. Using OpenTelemetry, engineering teams can instrument polyglot and distributed applications with peace of mind.
SigNoz is an open-source observability tool that comes with a SaaS-like experience. You can try out SigNoz by visiting its GitHub repo 👇
If you have any questions or need any help in setting things up, join our slack community and ping us in #support channel.

Further Reading
Implementing OpenTelemetry in Angular application
Monitor your Nodejs application with OpenTelemetry and SigNoz

Top comments (0)