The console is a space where it provides an interface to understand what's happening with your JavaScript code. This tool is very useful while debugging JavaScript application.
Web browsers has it's own console ::
Browsers have their own console. The consoles between browsers are largely similar to each other, with minor differences in style and capabilities.
Example : google browser / safari soo on..
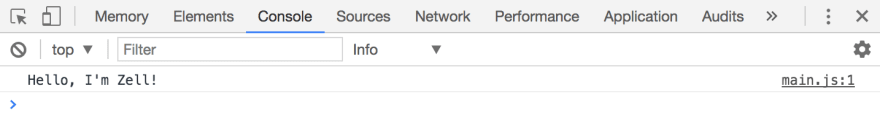
Sample image of a browser console.

Printing to the console
Code you type into your JavaScript file does not appear automatically in the console. This behavior is ideal because you can have hundreds of lines of JavaScript when you make something. It would be hard to debug if you were forced to look at hundreds of lines of logs every time!
To get things from your JavaScript file to the console, you need to use console.log. It looks like this:
console.log(Hello, I'm Zell!)
Happy Learning💗

Top comments (0)