
TL;DR: JavaScript memory leaks occur when allocated memory is not released after it’s no longer needed, impacting performance and potentially causing crashes. This guide outlines how to identify, fix, and prevent these leaks using various tools and techniques.
In JavaScript, memory management is handled through an automated garbage collector. It frees up the memory by reclaiming memory from unused objects. Automated memory management is helpful, but it’s not perfect. Memory leaks can still happen if objects are not properly cleared or released.
Over time, these leaks can slow down the application, reduce performance, and even cause it to crash.
This article will cover:
- What are memory leaks in JavaScript?
- How to detect memory leaks
- Common causes of memory leaks with examples
- Strategies to fix memory leaks
- Best practices to prevent memory leaks
What are memory leaks in JavaScript?
A memory leak occurs when allocated memory is not released after it’s no longer needed. This unused memory remains in the application’s heap memory, gradually consuming more resources. Memory leaks can happen when objects are still referenced even though they’re no longer needed, preventing garbage collection from reclaiming the memory.
Why are memory leaks harmful?
Memory leaks can lead to:
- Increased memory usage: Leaked memory takes up more space, slowing down the application.
- Performance degradation: High memory consumption can cause performance issues since it creates competition for available resources.
- Potential application crashes: If memory usage goes unchecked, it may cause the browser or application to crash.
How to detect memory leaks
Detecting memory leaks is the first step to addressing them. The following are ways you can locate memory leaks in JavaScript.
Using Chrome DevTools
Chrome DevTools offers several tools for analyzing memory usage:
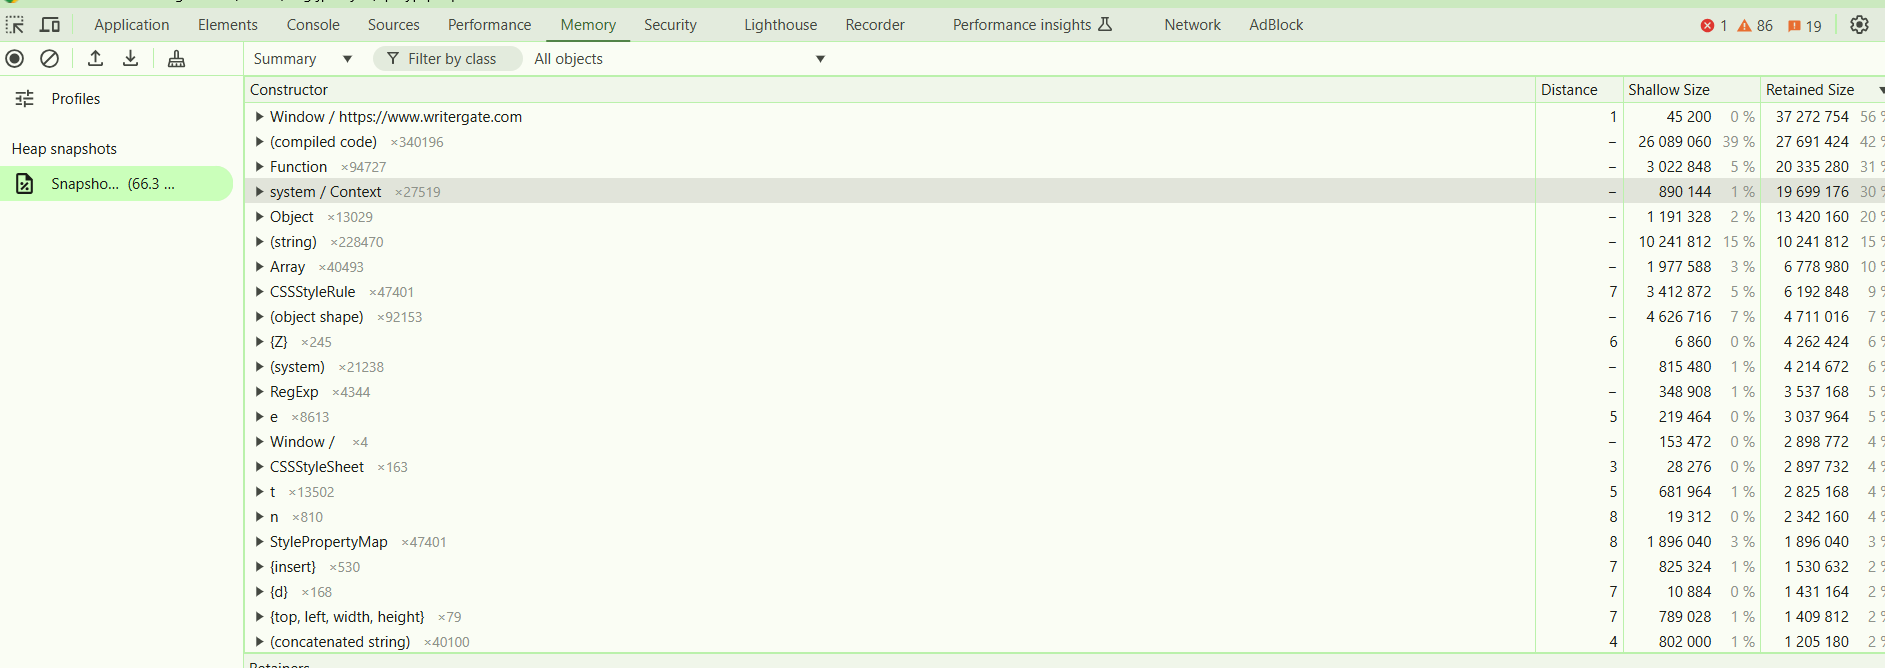
- Memory profiler: You can take memory snapshots to analyze retained objects and compare memory usage over time.
- Heap snapshots: You can capture a snapshot of JavaScript memory with details about allocated objects.
- Allocation timeline: Tracks how memory is allocated and shows if memory usage trends upward.
To use the heap snapshot feature:
- Open Chrome DevTools (Ctrl+Shift+I or Cmd+Option+I).
- Go to the Memory tab.
- Select Take Heap Snapshot to capture a snapshot of your memory usage.
- Compare snapshots over time to identify if memory usage is increasing.
Monitoring the timeline in DevTools
The Performance tab provides a broader look at memory usage over time, enabling you to see trends in real-time:
- Open DevTools and select the Performance tab.
- Start recording by clicking Record.

Interact with your app to observe the memory allocation behavior.
Watch for memory that doesn’t free up after interactions, which may indicate a leak.

Using third-party tools
Third-party tools, like Heapdumps and Memoryleak.js, can also help analyze memory usage in more complex applications, especially for Node.js environments.
Common causes of memory leaks in JavaScript
In JavaScript, there are several common root causes for most memory leaks.
Global variables
Variables defined in the global scope persist throughout the lifecycle of the application. Overuse of global variables or improper cleanup can lead to memory leaks.
Example:
function createLeak() {
  let leakedVariable = "I am a global variable"; // Proper declaration
}
Solution: Always declare variables with let, const, or var to avoid accidentally polluting the global scope.
Closures
Closures retain references to their parent scope variables. If a closure is misused, it can keep references alive longer than needed, causing a leak.
Example:
function outer() {
  const bigData = new Array(1000); // Simulating large data
  return function inner() {
    console.log(bigData);
  };
}

const leak = outer(); // bigData is still referenced by leak
Solution: If you must use closures, ensure that any references are cleared when no longer needed.
Unnecessary event listeners
An event listener maintains a reference to its target element, potentially leading to memory issues. So, the risk of memory leaks can grow with the number of event listeners you use.
Example:
const button = document.getElementById('myButton');
button.addEventListener('click', () => {
  console.log("Button clicked");
});
Solution: Remove event listeners when they’re no longer needed.
button.removeEventListener('click', handleClick);
Forgotten intervals and timeouts
Intervals and timeouts that aren’t cleared can continue running, causing memory to be occupied indefinitely.
Example:
setInterval(() => {
  console.log("This can go on forever if not cleared");
}, 1000);
Solution: Clear intervals and timeouts when they are no longer needed.
const interval = setInterval(myFunction, 1000);
clearInterval(interval);
How to fix memory leaks
Once identified, memory leaks can often be resolved by carefully managing references and releasing memory when no longer required.
Manual garbage collection
JavaScript automatically manages memory, but manual actions can sometimes help speed up garbage collection:
- Set unused objects to null to release references and allow garbage collection.
- Remove properties or reset values on large objects when they’re no longer needed.
Clean up DOM references
DOM nodes with event listeners or data can cause memory leaks if they are improperly removed. Ensure you remove any references to DOM elements after they’re detached.
Example:
const element = document.getElementById('tempElement');
element.parentNode.removeChild(element);
element = null; // Clear reference
Use WeakMap for cache management
If you need to cache objects, WeakMap allows garbage collection of entries if there are no other references to them.
Example:
const cache = new WeakMap();

function storeData(obj) {
  cache.set(obj, "Some data");
}
This way, cached objects are automatically released once all other references are removed.
Best practices to prevent memory leaks
Preventing memory leaks is more efficient than fixing them after they occur. Here are some best practices you can follow to prevent memory leaks in JavaScript.
Use local scope for variables
Keep variables scoped to functions or blocks, minimizing the use of global variables.
Example:
function handleData() {
  let localData = "Some data";
}
Remove event listeners on unmount
When using frameworks like React, make sure to clean up event listeners in componentWillUnmount or useEffect cleanup functions.
Example (React):
useEffect(() => {
  const handleResize = () => console.log("Resize event");

  window.addEventListener("resize", handleResize);

  return () => {
    window.removeEventListener("resize", handleResize);
  };
}, []);
Clear intervals and timeouts
Clear intervals and timeouts within cleanup functions in your code.
Example:
let timer = setTimeout(() => console.log("Timeout"), 1000);
clearTimeout(timer);
Use weak references for cache
Use WeakMap or WeakSet to manage cached data. Unlike regular objects, they allow garbage collection when keys are no longer needed.
Example:
const cache = new WeakMap();
const obj = { key: "value" };
cache.set(obj, "cached data");

// Later, if the obj has no other references, it can be garbage-collected.
Regularly profile and test for leaks
Memory management is an ongoing process. Use tools like Chrome DevTools regularly to profile your application and detect memory issues early.
Conclusion
Memory leaks can easily create performance issues in your JavaScript applications, resulting in a bad user experience. By understanding the common causes of memory leaks (such as global variables, closures, and event listeners), you can prevent them.
Managing memory effectively in JavaScript applications requires close attention. Regularly test your code and profile memory usage. Always clean up resources when they’re no longer needed. This proactive approach will result in a faster, more reliable, and enjoyable user application. I hope you found this article helpful. Thank you for reading.

Top comments (0)