I'm a beginner at Python, but I like to learn new things, so I gathered maybe someone would get some value from my adventures.

I was doing some exercises from the book Math for programmers*. I was wondering if I should use Matplotlib for it, but frankly, just didn't want to bother learning all the ins and outs of Matplotlib, instead opting for learning a Gui tool for Python. Where I could both learn the math and the Gui at the same time.
Basically the Goal of the simple exercise was to draw a dinosaur with points. A list of (x,y) vectors.
Also I wanted to be able to create a graph with axis's that are able to run mathematical functions.
Setting up the basic view
import sys
##PyQt5==5.14.0
from PyQt5.QtGui import *
from PyQt5.QtCore import *
from PyQt5.QtWidgets import *

WIDTH = 1200
HEIGHT = 1000
#Tuple defining  the center of the view.
ORIGO = (WIDTH/2, HEIGHT/2)
SCALE = 50

class Widget(QWidget):
    painter = None

    def __init__(self):
        super().__init__()

    def paintEvent(self, event):
        self.painter = QPainter(self)
        self.painter.setBrush(50)
##Uncomment these as you  create  the functions.
        #self.drawAxis()
        #self.drawShape(dino_vectors)
        self.painter.end()

#Setting up the Widget
if __name__ == '__main__':
    app = QApplication(sys.argv)
    ex = Widget()
    ex.resize(WIDTH, HEIGHT)
    ex.show()
    sys.exit(app.exec_())
The first challenge then was to define origo to be in the center of the window. As origon initially is in the upper left of the Gui window. Simple enough, just divide x and y by 2.
Next I began to plot the coordinates out. I had to create a related to origon method, to translate the x, y coordinates. Because the y direction is down for instance, and the placement of origon.
- QPoint is an object in PyQt which contains the point value, here the position parameter, a tuple is mapped into a QPoint object.
    def relatedToOrigo(self, position, scale=True):
        if scale:
            return QPoint(int(ORIGOT[0]+position[0] * SCALE), int(ORIGOT[1]-position[1] * SCALE))
        return QPoint(int(ORIGOT[0]+position[0]),
int(ORIGOT[1]-position[1]))
Then we can begin to draw the shape. Starting with a move to the first position and starting from there drawing the figure.
    def drawShape(self, vectors, scale=True, color=Qt.blue):
        path = QPainterPath()
        path.moveTo(self.relatedToOrigo(vectors[0], scale))
        self.painter.setPen(color)
        for i in vectors:
            path.lineTo(self.relatedToOrigo(i, scale))
        self.painter.drawPath(path)
Then we can insert a list of tuple in the method.
#Define the vectors of  the Dino.
dino_vectors = [(6, 4), (3, 1), (1, 2), (-1, 5), (-2, 5), (-3, 4), (-4, 4), (-5, 3), (-5, 2), (-2, 2), (-5,1), (-4, 0), (-2, 1), (-1, 0), (0, -3), (-1, -4), (1, -4), (2, -3), (1, -2), (3, -1), (5, 1), (7, 4), (6, 4)]

  def paintEvent(self, event):
       #uncomment the drawShape method in the paintEvent
        self.drawShape(dino_vectors)
Turning the vectors into a beautiful dinosaur.

This worked great, but for further use, I wanted a graph tool, which would at the bare minimum have an x- and a y-axis. Where mathematical functions could be inserted. Like a classic Texas calculator or the like.
    def drawAxis(self):
        _tinyLine = 5
        _smallLine = 10
        _axisPen = QPen(Qt.green, 1)
        _numberPen = QPen(Qt.red, 2, Qt.DotLine)

        self.painter.setPen(_axisPen)
        self.painter.drawLine(0, HEIGHT/2, WIDTH, HEIGHT/2)
        self.painter.drawLine(WIDTH/2, 0, WIDTH/2, HEIGHT)

        # X-axis
        for i in range(int(-ORIGO[0]), int(ORIGO[0]) + SCALE, SCALE):
            if i is 0:
                continue
            self.painter.setPen(_axisPen)
            if i % 100 is 0:
                self.painter.drawLine(
                    i + ORIGO[0], ORIGO[1] + _smallLine, i + ORIGO[0], ORIGO[1] - _smallLine)
            else:
                self.painter.drawLine(
                    i + ORIGO[0], ORIGOT[1] + _tinyLine, i + ORIGO[0], ORIGO[1] - _tinyLine)

            # X axis numbers
            self.painter.setPen(_numberPen)
            rectangle = QRect(i + ORIGO[0] - _smallLine, ORIGO[1] + 15, i + ORIGO[0], ORIGO[1])
            self.painter.drawText(rectangle, 0, str(i))

        # Y-axis
        for i in range(int(-ORIGO[1]), int(ORIGO[1]) + SCALE, SCALE):
            if i is 0:
                continue
            self.painter.setPen(_axisPen)
            if i % 100 is 0:
                # a insertion for each hundrer in range
                self.painter.drawLine(ORIGOT[0] - _smallLine, i + ORIGO[1], ORIGO[0] + _smallLine, i + ORIGOT[1])
            else:
                self.painter.drawLine(
                    ORIGO[0] - _tinyLine, i + ORIGO[1], ORIGO[0] + _tinyLine, i + ORIGO[1])

            # Y axis numbers
            self.painter.setPen(_numberPen)
            rectangle = QRect(ORIGO[0] + 15, i + ORIGO[1]-6, ORIGO[0], i + ORIGO[1])
            self.painter.drawText(rectangle, 0, str(-i))
Uncomment the drawAxis funtion and run to produce these axis's.

Now we have all the magic so let's test it out.
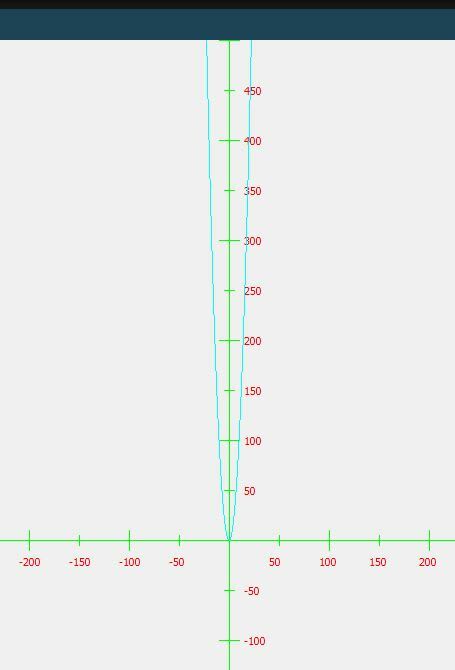
Can it math out the graphs?
Let's insert a 2nd degree function! X^2.
    def paintEvent(self, event):
        self.painter = QPainter(self)
        self.painter.setBrush(50)
        self.drawAxis()
        happy_vectors = []
        for x in range(-500, 500):
            vector = (x, x**2)
            happy_vectors.append(vector)

        self.drawShape(happy_vectors, False, Qt.cyan)
        self.painter.end()
And that's how I did the things.
Complete:
import sys
from PyQt5.QtGui import *
from PyQt5.QtCore import *
from PyQt5.QtWidgets import *

WIDTH = 1200
HEIGHT = 1000
ORIGO = QPoint(WIDTH/2, HEIGHT/2)
ORIGOT = (WIDTH/2, HEIGHT/2)
SCALE = 50

dino_vectors = [(6, 4), (3, 1), (1, 2), (-1, 5), (-2, 5), (-3, 4), (-4, 4),
                (-5, 3), (-5, 2), (-2, 2), (-5, 1), (-4, 0), (-2, 1), (-1, 0), (0, -3),
                (-1, -4), (1, -4), (2, -3), (1, -2), (3, -1), (5, 1), (7, 4), (6, 4)]

class Widget(QWidget):
    painter = None

    def __init__(self):
        super().__init__()

    def paintEvent(self, event):
        self.painter = QPainter(self)
        self.painter.setBrush(50)
        self.drawAxis()
        self.drawShape(dino_vectors)

        function_vectors = []
        for x in range(-500, 500):
            vector = (x, x**2)
            function_vectors.append(vector)

        #self.drawShape(function_vectors, False, Qt.cyan)
        self.painter.end()

    def drawShape(self, vectors, scale=True, color=Qt.blue):
        path = QPainterPath()
        path.moveTo(self.relatedToOrigo(vectors[0], scale))
        self.painter.setPen(color)
        for i in vectors:
            path.lineTo(self.relatedToOrigo(i, scale))
        self.painter.drawPath(path)

    def relatedToOrigo(self, position, scale=True):
        if scale:
            return QPoint(int(ORIGOT[0]+position[0] * SCALE), int(ORIGOT[1]-position[1] * SCALE))
        return QPoint(int(ORIGOT[0]+position[0]), int(ORIGOT[1]-position[1]))

    def drawAxis(self):
        _tinyLine = 5
        _smallLine = 10
        _axisPen = QPen(Qt.green, 1)
        _numberPen = QPen(Qt.red, 2, Qt.DotLine)

        self.painter.setPen(_axisPen)
        self.painter.drawLine(0, HEIGHT/2, WIDTH, HEIGHT/2)
        self.painter.drawLine(WIDTH/2, 0, WIDTH/2, HEIGHT)

        # X-axis
        for i in range(int(-ORIGOT[0]), int(ORIGOT[0]) + SCALE, SCALE):
            if i is 0:
                continue
            self.painter.setPen(_axisPen)
            if i % 100 is 0:
                self.painter.drawLine(
                    i + ORIGOT[0], ORIGOT[1] + _smallLine, i + ORIGOT[0], ORIGOT[1] - _smallLine)
            else:
                self.painter.drawLine(
                    i + ORIGOT[0], ORIGOT[1] + _tinyLine, i + ORIGOT[0], ORIGOT[1] - _tinyLine)

            # X axis numbers
            self.painter.setPen(_numberPen)
            rectangle = QRect(i + ORIGOT[0] - _smallLine, ORIGOT[1] + 15, i + ORIGOT[0], ORIGOT[1])
            self.painter.drawText(rectangle, 0, str(i))

        # Y-axis
        for i in range(int(-ORIGOT[1]), int(ORIGOT[1]) + SCALE, SCALE):
            if i is 0:
                continue
            self.painter.setPen(_axisPen)
            if i % 100 is 0:
                # a insertion for each hundrer in range
                self.painter.drawLine(ORIGOT[0] - _smallLine, i + ORIGOT[1], ORIGOT[0] + _smallLine, i + ORIGOT[1])
            else:
                self.painter.drawLine(
                    ORIGOT[0] - _tinyLine, i + ORIGOT[1], ORIGOT[0] + _tinyLine, i + ORIGOT[1])

            # Y axis numbers
            self.painter.setPen(_numberPen)
            rectangle = QRect(ORIGOT[0] + 15, i + ORIGOT[1]-6, ORIGOT[0], i + ORIGOT[1])
            self.painter.drawText(rectangle, 0, str(-i))


if __name__ == '__main__':
    app = QApplication(sys.argv)
    ex = Widget()
    ex.resize(WIDTH, HEIGHT)

    # setting colortheme
    ex.setAutoFillBackground(True)
    palette = ex.palette()
    palette.setColor(ex.backgroundRole(), Qt.black)
    ex.setPalette(palette)

    ex.show()
    sys.exit(app.exec_())

Top comments (0)