
This tutorial focuses on integrating Chart.js with Next.js, a powerful React framework. Readers will learn how to create dynamic, interactive charts that can be easily integrated into their Next.js applications. The tutorial will cover installation, configuration, and practical examples to illustrate how to leverage Chart.js for data visualization. By the end of the tutorial, readers will be equipped with the skills to implement various types of charts, customize them, and understand best practices for performance optimization.
In this tutorial, we will cover the following main topics:
- Introduction to Chart.js and Next.js
- Creating Your First Chart
- Customizing and Optimizing Charts in Next.js
In this tutorial, we will create a chart that visualizes diagnosis history, as illustrated in the following figure:
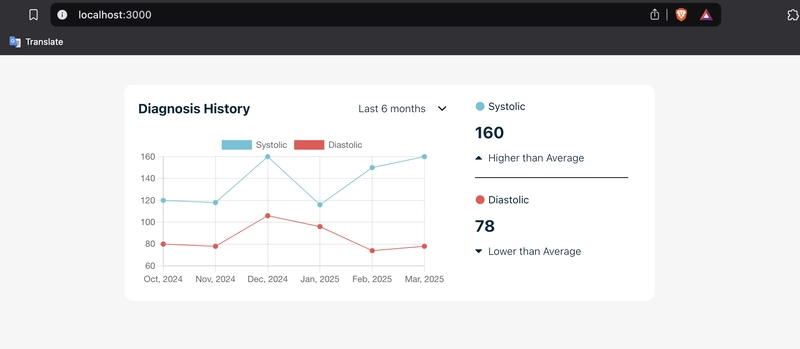
Fig 1: Chart Showing Diagnosis History
Introduction to Chart.js in Next.js
Data visualization is an important part of modern web applications. Whether you're displaying sales data, user analytics, or financial reports, showing numbers in a well-structured chart helps users understand data quickly.
In this section, we will introduce Chart.js, a JavaScript library that makes it easy to create interactive and beautiful charts. You will learn why Chart.js is a great choice for data visualization and how to integrate it into a Next.js application.
By the end of this section, you’ll have a solid understanding of:
- What Chart.js is and why it is useful.
- How to install and set up Chart.js in a Next.js project.
- How Next.js’s rendering methods impact Chart.js and how to use it properly in a React-based framework.
What is Chart.js?
Chart.js is a popular JavaScript library used for creating beautiful and interactive charts. It supports various chart types, such as line, bar, pie, and more. Developers appreciate Chart.js for its simplicity and flexibility, making it easy to visualize data in web applications. The library is lightweight and can be easily integrated into different frameworks, including React.
Why Use Chart.js in Next.js Applications?
Next.js is a powerful React framework that enables server-side rendering, static site generation, and easy routing. Integrating Chart.js into a Next.js application allows you to leverage these features while creating dynamic, data-driven visualizations. By using Chart.js in Next.js, you can:
- Improve Performance: Server-side rendering can speed up initial load times, making charts appear faster for users.
- Enhance User Experience: Interactive charts provide a better way to present information, allowing users to gain insights quickly.
- Simplify Data Fetching: Next.js makes it easy to fetch data from APIs, which can then be visualized using Chart.js.
Installing Chart.js and Dependencies
To get started with Chart.js in a Next.js project, you first need to set up your Next.js environment. Here’s how to do it:
Step 1: Open your terminal and run the following command:
npx create-next-app@latest my-chart-app
Replace my-chart-app with your preferred project name. This command will create a new directory with all the necessary files to start a Next.js application.
or you clone the repo:
git clone https://github.com/Willochs316/chart-app.git
Step 2: Navigate to Your Project Directory:
cd my-chart-app
Step 3: Install Chart.js and React-Chartjs-2:
React-Chartjs-2 is a wrapper for Chart.js that makes it easier to use within React applications. Install both libraries using:
npm install chart.js react-chartjs-2
Once installed, you can check your package.json file to confirm that both dependencies have been added:
  "dependencies": {
    "chart.js": "^4.4.8",
    "next": "15.2.3",
    "react": "^19.0.0",
    "react-chartjs-2": "^5.3.0",
    "react-dom": "^19.0.0"
  },
Understanding Next.js’s Rendering Methods and How They Affect Chart.js
Next.js provides different ways to render components:
- Server-Side Rendering (SSR) – Renders pages on the server before sending them to the browser.
- Static Site Generation (SSG) – Pre-builds pages at build time.
- Client-Side Rendering (CSR) – Renders components on the client side after the page loads.
Since Chart.js runs in the browser (it requires window and document objects), we cannot use it directly in server-rendered pages. If we try to import Chart.js in a page that is server-rendered, it may cause errors like:
ReferenceError: window is not defined
Solution
"use client"
Summary of What You Have Learned
In this section, you learned:
- What
Chart.jsis and why it’s a great tool for data visualization. - Why
Next.jsis a good choice for integratingChart.js. - How to install
Chart.jsandreact-chartjs-2in a Next.js project. - How
Next.js’srendering methods affectChart.jsand how to prevent errors using dynamic imports.
What’s Next?
Now that we have installed Chart.js and understand its role in a Next.js application, it’s time to create our first charts!
Creating Your First Chart with Chart.js and JSON Server
Now that we have Chart.js set up in our Next.js project, it’s time to create our first chart! But instead of using static data, we’ll take a real-world approach and fetch our data from an API.
To do this, we’ll use JSON Server, a simple tool that allows us to create a REST API using a local db.json file. This will help us understand how to fetch and display real-time data inside a Chart.js chart in a Next.js application.
By the end of this section, you’ll learn:
- How to structure and configure data for
Chart.js. - How to use the
react-chartjs-2wrapper to integrate Chart.js with React components inNext.js. - How to fetch data from a REST API (JSON Server) and use it in a chart.
Setting Up JSON Server
First, we need to set up JSON Server to serve our mock data. Follow these steps:
Step 1: Install JSON Server
Open your terminal and install JSON Server globally:
npm install -g json-server
You can check if the installation was successful by running:
json-server --version
Step 2: Create a Folder and a db.json File
Inside your Next.js project, create a folder named _data, then inside that folder, create a file called db.json.
my-chart-app/
│-- _data/
│   ├── db.json
│-- pages/
│-- components/
│-- package.json
│-- ...
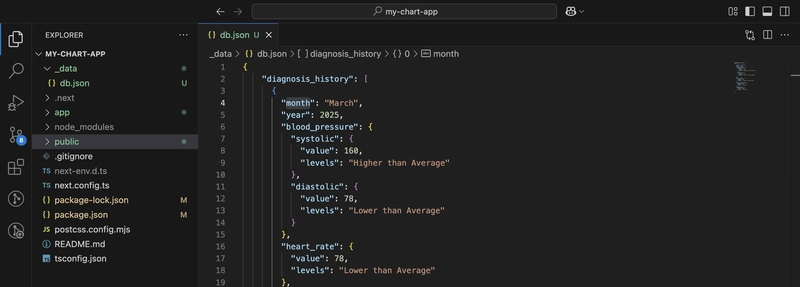
Fig 2: _data Folder and db.json file
Now, open db.json and add the following sample medical diagnosis history data:
{
  "diagnosis": [
    {
      "month": "March",
      "year": 2024,
      "blood_pressure": {
        "systolic": {
          "value": 160,
          "levels": "Higher than Average"
        },
        "diastolic": {
          "value": 78,
          "levels": "Lower than Average"
        }
      },
      "heart_rate": {
        "value": 78,
        "levels": "Lower than Average"
      },
      "respiratory_rate": {
        "value": 20,
        "levels": "Normal"
      },
      "temperature": {
        "value": 98.6,
        "levels": "Normal"
      }
    }
  ]
}
app/types/diagnosis.ts
export type DiagnosisEntry = {
    month: string;
    year: number;
    blood_pressure: {
      systolic: {
        value: number;
        levels: string;
      };
      diastolic: {
        value: number;
        levels: string;
      };
    };
    heart_rate: {
      value: number;
      levels: string;
    };
    respiratory_rate: {
      value: number;
      levels: string;
    };
    temperature: {
      value: number;
      levels: string;
    };
  };
Step 3: Start JSON Server
Now click the plus icon on your code editor (vscode) to add a new terminal to your existing terminal, start the JSON Server by running:
json-server --watch _data/db.json --port 4000
This will create a local API Endpoints at:
http://localhost:4000/diagnosis
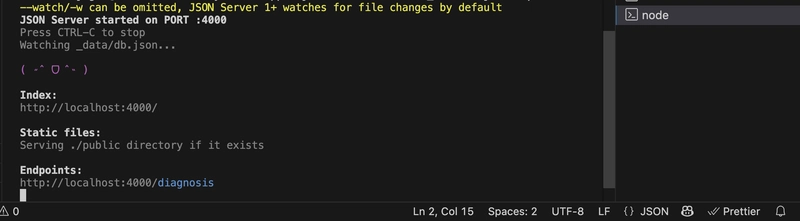
Fig 3: JSON Server Running
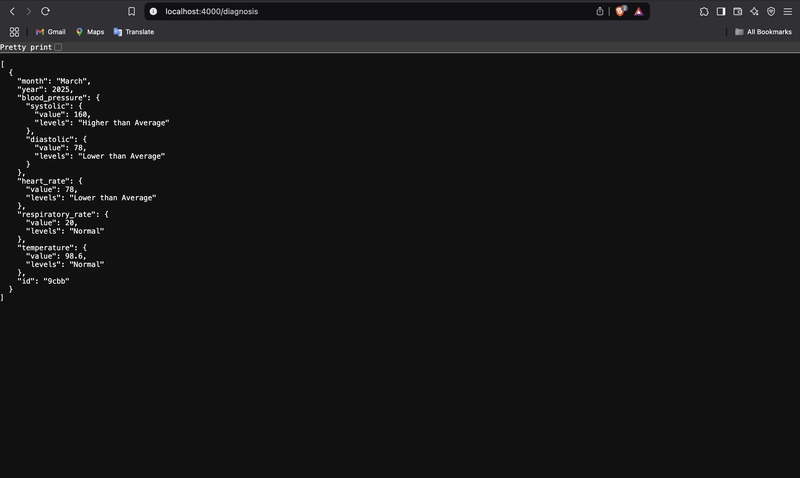
You can test it by opening your browser and visiting http://localhost:4000/diagnosis. You should see the JSON data displayed.
Fetching Data in Next.js
Now that we have our API running, let’s fetch the data in Next.js.
Step 1: Create a Function to Fetch Data
Inside your app folder in your Next.js project, create a file called api.ts inside a folder named utils/. This file will contain a function to fetch data from the JSON server.
app/utils/api.ts
export async function getDiagnosis() {
    try {
      const res = await fetch("http://localhost:4000/diagnosis");
      if (!res.ok) throw new Error("Failed to fetch data");

      const data = await res.json();

      // Get today's date
      const currentDate = new Date();
      const currentMonth = currentDate.getMonth() + 1; // Months are 0-based in JS
      const currentYear = currentDate.getFullYear();

      // Convert month names to numbers for easy filtering
      const monthMap: { [key: string]: number } = {
        January: 1, February: 2, March: 3, April: 4, May: 5, June: 6,
        July: 7, August: 8, September: 9, October: 10, November: 11, December: 12
      };

      // Get the last 6 months of data
      const last6Months = data.filter((entry: any) => {
        const entryMonth = monthMap[entry.month];
        const entryYear = entry.year;

        const monthDiff = (currentYear - entryYear) * 12 + (currentMonth - entryMonth);
        return monthDiff >= 0 && monthDiff < 6; // Only last 6 months
      });

      return last6Months;
    } catch (error) {
      console.error("Error fetching diagnosis history:", error);
      return [];
    }
  }
Creating a Chart Component in Next.js
Now, let’s create a Chart.js component to display the blood pressure levels from our API.
Step 1: Create a Chart Component
Inside your app folder in your Next.js project, create a folder named components/, and inside it, create a file called chart.tsx.
app/components/chart.tsx
"use client";
import React from "react";
import dynamic from "next/dynamic";
import {
  Chart as ChartJS,
  CategoryScale,
  LinearScale,
  PointElement,
  LineElement,
  Title,
  Tooltip,
  Legend,
} from "chart.js";
import Image from "next/image";
import ArrowDown from "@/public/icons/arrow-down.svg";
import ArrowUp from "@/public/icons/arrow-up.svg";
import { DiagnosisEntry } from "@/app/types/diagnosis";
import ExpandMore from "@/public/icons/expand-more.svg";

// Register the components
ChartJS.register(
  CategoryScale,
  LinearScale,
  PointElement,
  LineElement,
  Title,
  Tooltip,
  Legend
);

// Dynamically import Line from react-chartjs-2
const LineChart = dynamic(
  () => import("react-chartjs-2").then((mod) => mod.Line),
  { ssr: false }
);

type MyChartProps = {
  diagnosis: DiagnosisEntry[];
};

export function MyChart({ diagnosis }: MyChartProps) {
  // Sort data by date to ensure correct order
  diagnosis.sort((a: DiagnosisEntry, b: DiagnosisEntry) => {
    const monthOrder: { [key: string]: number } = {
      January: 1,
      February: 2,
      March: 3,
      April: 4,
      May: 5,
      June: 6,
      July: 7,
      August: 8,
      September: 9,
      October: 10,
      November: 11,
      December: 12,
    };

    return a.year - b.year || monthOrder[a.month] - monthOrder[b.month];
  });

  // Extract labels and data
  const labels = diagnosis.map(
    (entry: DiagnosisEntry) => `${entry.month.slice(0, 3)}, ${entry.year}`
  );
  const systolicData = diagnosis.map(
    (entry: DiagnosisEntry) => entry.blood_pressure.systolic.value
  );
  const diastolicData = diagnosis.map(
    (entry: DiagnosisEntry) => entry.blood_pressure.diastolic.value
  );

  return (
    <>
      <div className="flex items-start mt-[40px] bg-[#fff] p-[19px] rounded-[12px] w-1/2 h-auto mx-auto">
        <div className="w-[418px]">
          <div className="flex items-center justify-between w-full">
            <h2 className="text-[#072635] text-[18px] font-bold">
              Diagnosis History
            </h2>

            <button className="flex items-center justify-between w-[119px]">
              <span className="text-[14px] text-[#072635] font-light">
                Last 6 months
              </span>

              <Image src={ExpandMore} alt="" />
            </button>
          </div>

          <div className="mt-[20px] w-full">
            <LineChart
              data={{
                labels: labels,
                datasets: [
                  {
                    label: "Systolic",
                    data: systolicData,
                    backgroundColor: "#5FC3D6",
                    borderColor: "#5FC3D6",
                    borderWidth: 1,
                  },
                  {
                    label: "Diastolic",
                    data: diastolicData,
                    backgroundColor: "#EC5252",
                    borderColor: "#EC5252",
                    borderWidth: 1,
                  },
                ],
              }}
              options={{
                responsive: true,
                maintainAspectRatio: true,
                scales: {
                  x: {
                    beginAtZero: true,
                  },
                  y: {
                    beginAtZero: false,
                    min: 60,
                  },
                },
              }}
            />
          </div>
        </div>

        <div className="w-[208px] flex flex-col items-start justify-center ml-[39.05px]">
          <div className="flex flex-col items-start justify-center w-full">
            <div className="flex items-center w-full">
              <span className="w-[14px] h-[14px] rounded-full bg-[#5FC3D6] border border-[#FFFFFF]"></span>
              <span className="text-[#072635] ml-[4px] text-[14px] font-normal">
                Systolic
              </span>
            </div>

            <h2 className="text-[#072635] text-[22px] font-bold mt-[8px]">
              {diagnosis[5].blood_pressure.systolic.value}
            </h2>

            <div className="flex items-center w-full mt-[8px]">
              <Image
                className="w-[10px] h-[5px]"
                width={10}
                height={5}
                src={ArrowUp}
                alt=""
              />
              <span className="text-[#072635] text-[14px] ml-[8px] font-light">
                Higher than Average
              </span>
            </div>

            <hr className="w-full h-[1px] mt-[16px] bg-[#CBC8D4]" />

            <div className="flex items-center w-full mt-[19px]">
              <span className="w-[14px] h-[14px] rounded-full bg-[#EC5252] border border-[#FFFFFF]"></span>
              <span className="text-[#072635] ml-[4px] text-[14px] font-normal">
                Diastolic
              </span>
            </div>
            <h2 className="text-[#072635] text-[22px] font-bold mt-[8px]">
              {diagnosis[5].blood_pressure.diastolic.value}
            </h2>

            <div className="flex items-center w-full mt-[8px]">
              <Image
                className="w-[10px] h-[5px]"
                width={10}
                height={5}
                src={ArrowDown}
                alt=""
              />
              <span className="text-[#072635] text-[14px] ml-[8px] font-light">
                Lower than Average
              </span>
            </div>
          </div>
        </div>
      </div>
    </>
  );
}
page.tsx
import { getDiagnosis } from "@/app/utils/app";
import { MyChart } from "@/app/components/chart";

export default async function Home() {
  const diagnosis = await getDiagnosis();

  return (
    <div className="max-w-full w-full">
      <MyChart diagnosis={diagnosis} />
    </div>
  );
}
Follow me
 |
 |
 |
 |

Top comments (0)