You know that feeling when you check your Anthropic bill and think... where did all those tokens go?
I've been using Claude Code daily for months. It's incredible — but it's also a black box. I had no idea which sessions were burning through Opus tokens on trivial tasks, which prompts were triggering tool loops, or how much money I was wasting by not leveraging prompt caching.
So I built Claude Code Dashboard — a local-first analytics platform that reads your Claude Code session logs and turns them into actionable insights.
Zero telemetry. Zero outbound connections. Your data never leaves localhost.
npx claude-code-insights
That's it. One command. Dashboard opens at localhost:3838.
The Problem
Claude Code stores rich session logs in ~/.claude/projects/ — every message, tool call, token count, and model used. But there's no built-in way to:
- See how much you're spending per day, per model, per session
- Detect when Claude gets stuck in a tool loop (calling
Bash12 times in a row) - Know if you're actually benefiting from prompt caching
- Compare your Opus vs Sonnet usage patterns
- Watch what Claude is doing in real-time across concurrent sessions
All that data is just sitting there in JSONL files. I wanted to make it useful.
What It Does
Overview Dashboard
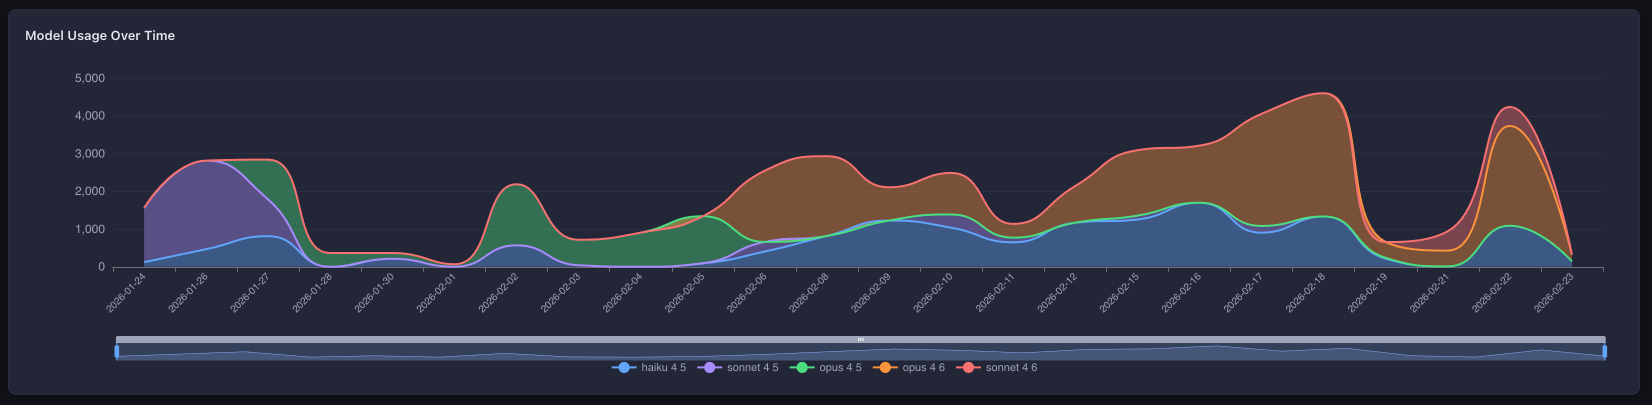
The landing page gives you the big picture: daily activity charts, cost trends, model distribution, and a GitHub-style activity heatmap. One glance tells you your coding rhythm with Claude.
Session Browser
Every Claude Code session you've ever run, in a virtual-scrolled table with multi-column sorting. Filter by project, date range, model, or cost. Toggle columns on/off. Click into any session for the full message-by-message breakdown.
Live Monitor
This one's my favorite. Real-time streaming via Server-Sent Events — you can watch Claude work as it happens:
- Per-session KPI counters (messages, tokens, cost, tool calls)
- Task progress tracking pulled from Claude's TodoWrite output
- A terminal-style message feed showing user/assistant/tool/system events
- Switch between concurrent active sessions
It's like htop for your AI coding sessions.
Cost Analytics
This is where it gets interesting. Most tools show you "total cost." This dashboard breaks down four token dimensions:
| Dimension | What It Is |
|---|---|
| Input tokens | What you send to Claude |
| Output tokens | What Claude generates |
| Cache read tokens | Tokens served from Anthropic's prompt cache |
| Cache write tokens | Tokens written to cache for future reuse |
You get per-model breakdowns, daily trends, a 30-day cost forecast, and — critically — a cache efficiency section that shows your hit rate, estimated savings, and what you would have paid without caching.
If your cache hit rate is below 20%, the dashboard tells you. With a specific recommendation.
AI Insights — A Linter for Your AI Usage
This is the feature I'm most proud of. 10 automated detection rules that analyze every session and flag patterns you'd never catch manually:
| Rule | What It Catches |
|---|---|
| Cost Spike | Session costs 3x+ your average |
| Tool Loop | Same tool called 5+ times with no other tools |
| Context Bloat | 1000+ input tokens with < 20% cache hit rate |
| Error Cascade | 30%+ tool error rate in a session |
| Idle Session | 1+ hour session with < 5 messages/hour |
| Model Mismatch | Opus used for simple tasks (< 10 messages) |
| Large Output | 50,000+ output tokens in a single session |
| Abandoned Session | Only 1-2 messages sent |
| Cache Miss Rate | < 10% cache hits with 10K+ input tokens |
| Token Waste | Average cost per message > $0.50 |
Each fires with a specific, actionable recommendation — not just a metric. "Opus used for a session with only 3 messages — consider Sonnet" is more useful than a pie chart.
Tools & Skills Analytics
See which tools Claude uses most, their error rates, and how that changes over time. Spot patterns — are your Bash calls failing because of permission issues? Is the Read tool being called redundantly?
Interactive Agent
You can run Claude Code sessions directly from the dashboard. Pick your model (Sonnet, Opus, Haiku), set a permission mode, and go. The dashboard shows real-time cost tracking and requires explicit approval for dangerous operations (file writes, shell commands).
This one requires an ANTHROPIC_API_KEY — but the key is read by the Claude Agent SDK from process.env. The dashboard never reads, stores, or logs it.
Security: Not a Feature — An Architecture
I'm opinionated about this: a local analytics tool that phones home is worse than useless. So security isn't a toggle — it's enforced at every layer.
Network Guard
At startup, the server monkey-patches net.Socket.prototype.connect to block all non-localhost TCP connections at the socket level. This runs before any other code:
const originalConnect = net.Socket.prototype.connect;

net.Socket.prototype.connect = function (...args) {
  const host = parseHost(args);
  if (!isLocalhost(host)) {
    this.destroy(new Error(`[network-guard] Blocked: ${host}`));
    blockedAttempts.push({ host, port, timestamp: Date.now() });
    return this;
  }
  return originalConnect.apply(this, args);
};
If any dependency tries to phone home — analytics, error reporting, anything — the connection is destroyed and logged. Not blocked by a firewall rule. Destroyed in code.
PII Detection
A regex-based scanner catches sensitive data before it reaches the browser:
- API keys (Anthropic
sk-ant-*, OpenAIsk-*, genericpk-*/rk-*/ak-*) - AWS credentials (
AKIA*,ABIA*,ACCA*,ASIA*) - GitHub tokens (
ghp_*,gho_*,ghu_*,ghs_*,ghr_*) - JWTs, private key headers, emails, IP addresses
Matches are replaced with [REDACTED:type] tokens. This runs at three pipeline points: before SQLite storage, before WebSocket transmission, and before SSE broadcast.
Everything Else
-
Read-only — never touches your
~/.claude/directory -
Localhost-only — server binds to
127.0.0.1 -
CSP headers —
default-src 'self',X-Frame-Options: DENY - Prepared statements — all SQLite queries are parameterized
- Zero telemetry — no analytics, no tracking, no phone-home
Tech Stack
| Layer | Technology |
|---|---|
| Frontend | Vue 3, TypeScript, Vite, Pinia, SCSS |
| Charts | ECharts (tree-shaken) |
| Tables | TanStack Vue Table + Vue Virtual |
| Backend | Fastify 5, better-sqlite3 (WAL mode) |
| Real-time | Server-Sent Events + WebSocket |
| Agent | Claude Agent SDK |
| Validation | Zod schemas as single source of truth |
| Testing | Vitest |
It's a pnpm monorepo with shared packages for cost calculation, session parsing, insight detection, and TypeScript types.
Quick Start
npx (no install)
npx claude-code-insights
Global install
npm install -g claude-code-insights
claude-code-insights
From source
git clone https://github.com/yahav10/claude-code-dashboard.git
cd claude-code-dashboard
pnpm install
bash scripts/build.sh
node packages/cli/dist/index.js
Opens a dashboard at http://localhost:3838 analyzing your sessions from ~/.claude/.
What I Learned About My Own Habits
Building this tool forced me to look at my own AI coding patterns. Some things I discovered:
I was using Opus for trivial tasks. The model-mismatch rule caught me sending 3-message sessions to Opus when Sonnet would have been identical quality at 40% the cost.
Tool loops are real. I had sessions where Claude called
Bash8+ times in a row trying to fix a test — each attempt slightly different but fundamentally the same approach. The tool-loop detector now alerts me when this happens.Cache efficiency varies wildly. Some projects had 60%+ cache hit rates (long sessions, stable context). Others were below 5% (lots of file switching, short sessions). The cache breakdown helped me restructure how I prompt.
My most expensive sessions were rarely my most productive. The cost-spike detector showed that high-cost sessions often correlated with context bloat and tool loops — not with actual feature delivery.
Contributing
The project is MIT-licensed and open for contributions. If you use Claude Code, I'd love your feedback:
Star the repo if you find it useful — it helps others discover it.
TL;DR: npx claude-code-insights gives you a local, private, zero-telemetry analytics dashboard for your Claude Code usage. Costs, caching, tool patterns, AI-powered insights, live monitoring — all from one command.
 yahav10
/
claude-code-dashboard
yahav10
/
claude-code-dashboard
Local-first analytics dashboard for Claude Code usage. Zero telemetry. Zero outbound connections.
📊 Claude Code Dashboard
Local-first analytics dashboard for Claude Code usage.
Understand your AI coding patterns, costs, and performance — all without leaving your machine.

Zero telemetry. Zero outbound connections. Your data never leaves localhost.
⚡ Quick Start
npx claude-code-insights
Opens a dashboard at http://localhost:3838 analyzing your Claude Code sessions from ~/.claude/.
Global install:
npm install -g claude-code-insights
✨ Features
| Feature | What it does |
|---|---|
| 📈 Overview Dashboard | KPIs, daily activity charts, cost trends, model distribution, weekly heatmap |
| 📋 Sessions Browser | Virtual-scrolled table with sorting, filters (date, model, project, cost), column toggles |
| 🔍 Session Detail | Message-by-message timeline, tool breakdown, cost waterfall |
| 🎯 Advanced Timeline | Gantt-style visualization with swim lanes, zoom, minimap, click-to-inspect |
| 📡 Live Monitor | Real-time per-session tracking via SSE with session switching and message feed |
| 🤖 Interactive Agent | Run Claude Code sessions from the dashboard (requires ANTHROPIC_API_KEY) |
| 💰 Cost Analytics | Per-model and per-day breakdowns with 30-day linear |


Top comments (0)