One of the main benefits of using an all-in-one observability suite like Stackdriver is that it provides all of the capabilities you may need. Specifically, your metrics, traces, and logs are all in one place, and with the GA release of Monitoring in the Cloud Console, that's more true than ever before. However, for the most part, each of these data elements are still mostly independent, and I wanted to attempt to try to unify two of them - traces and logs.
The idea for the project was inspired by the excellent work Alex Amies did in his Reference Guide on using OpenCensus to measure Spanner performance and troubleshoot latency. Specifically, he included an applog package that integrated traces and logs in OpenCensus:

I wanted to follow my post on tracing with OpenTelemetry and attempt to create integrated traces and logs. Let's dive in!
The app
I created a very basic Go app using the Mux router that:
- Receives a request on
/. - Sleeps between 0 and 9 seconds.
- Makes a backend call (to https://www.google.com)
My intent was to create a root span with two children - one for the delay that simulates an internal process and another for the backend call.
The code
Main function
func main() {
    initTracer()
    initLogger()
    defer closeLogger()

    r := mux.NewRouter()
    r.HandleFunc("/", mainHandler)

    if env == "LOCAL" {
        http.ListenAndServe("localhost:8080", r)
    } else {
        http.ListenAndServe(":8080", r)
    }
}
The main function simply sets up my tracing and logging and uses the mainHandler to respond to requests on /.
Tracing setup
func initTracer() {
    // Create Stackdriver exporter to be able to retrieve
    // the collected spans.
    exporter, err := stackdriver.NewExporter(
        stackdriver.WithProjectID(projectID),
    )
    if err != nil {
        log.Fatal(err)
    }

    // For the demonstration, use sdktrace.AlwaysSample sampler to sample all traces.
    // In a production application, use sdktrace.ProbabilitySampler with a desired probability.
    tp, err := sdktrace.NewProvider(sdktrace.WithConfig(sdktrace.Config{DefaultSampler: sdktrace.AlwaysSample()}),
        sdktrace.WithSyncer(exporter))
    if err != nil {
        log.Fatal(err)
    }
    global.SetTraceProvider(tp)
}
The tracing set up is pretty straightforward - I'm simply using the exporter written by Yoshi Yamaguchi, a fantastic Developer Advocate. It's the same exporter I used in my post on tracing without any changes.
Logging setup
This is where things start to get interesting.
func initLogger() {
    ctx := context.Background()
    var err error
    loggingClient, err = logging.NewClient(ctx, projectID)
    if err != nil {
        fmt.Printf("Failed to create logging client: %v", err)
        return
    }
    fmt.Printf("Stackdriver Logging initialized with project id %s, see Cloud "+
        " Console under GCE VM instance > all instance_id\n", projectID)
}
I've largely lifted this from Alex's work. The init function simply sets up the logging client.
Writing logs
This is where the trace/logging integration really happens.
// Send to Cloud Logging service including reference to current span
func printWithTrace(ctx context.Context, format string, v ...interface{}) {
    printf(ctx, logging.Info, format, v...)
}

// Send to Cloud Logging service including reference to current span
func printf(ctx context.Context, severity logging.Severity, format string,
    v ...interface{}) {
    span := trace.SpanFromContext(ctx)
    sCtx := span.SpanContext()
    tr := sCtx.TraceIDString()
    lg := loggingClient.Logger(LOGNAME)
    trace := fmt.Sprintf("projects/%s/traces/%s", projectID, tr)
    lg.Log(logging.Entry{
        Severity: severity,
        Payload:  fmt.Sprintf(format, v...),
        Trace:    trace,
        SpanID:   sCtx.SpanIDString(),
    })
}
In Stackdriver, traces and logs can be connected by writing the span ID and the trace ID in the payload of the log message. Here, I'm using the context to extract both the span and trace and then extract their IDs. I then write them to the log payload. Here's what a resulting log message looks like:
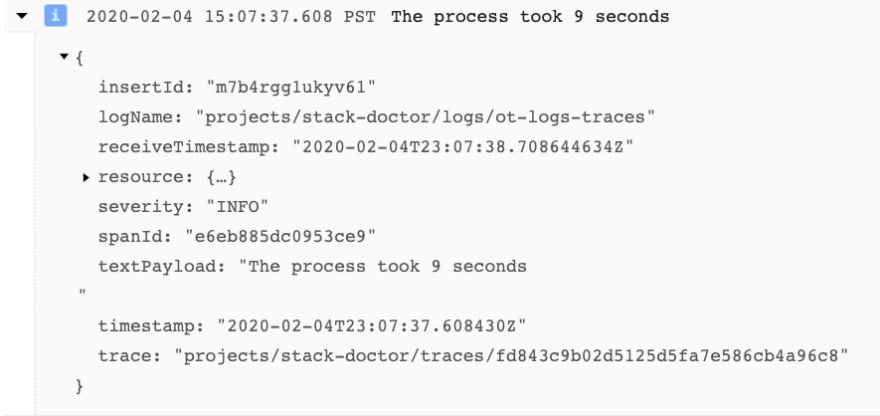
Notice that the spanId and trace fields are populated appropriately.
Viewing traces
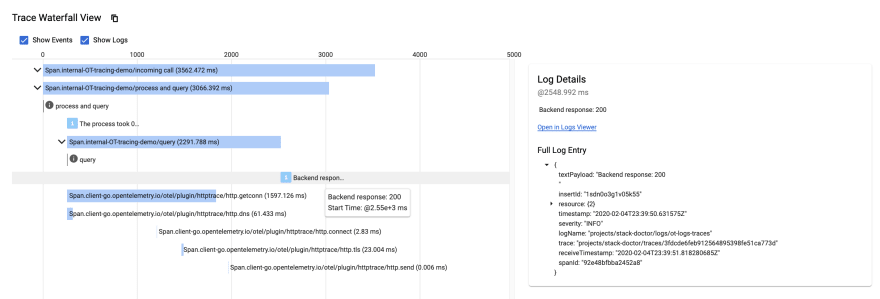
I can run the app locally (after using gcloud auth application-default login to write default credentials) and send traffic to http://localhost:8080. Here's a resulting trace:

Note that the trace contains both Events - added with the
span.AddEvent()method - and logs, written as described above.
Viewing logs
I can click on one of the log entries to see the full details of the log message:
I can then click Open in Logs Viewer and see this log entry there:

In conclusion...
I was very glad to see that this somewhat underappreciated functionality from OpenCensus still works in OpenTelemetry with minor changes. Specifically, I had to find the new APIs to use in printf() to extract the span from context and then get its span ID and trace ID, and this does not seem to be well documented. With that said, I hope this brief tutorial is useful to others looking to build a more integrated approach to observability with Stackdriver, especially in distributed systems. Many thanks for Alex for doing the original work on this, and thank you for reading!

Oldest comments (0)