If you are interested in developer trends you should check out my new newsletter at: unzip.dev
I was looking for a quick intro profiling in Go but everything was cumbersome, it seems that everyone points to pprof.
Let's say this is the code you want to profile:
package main

import (
    "fmt"
    "sync"
    "time"
)

// Some function that does work
func hardWork(wg *sync.WaitGroup) {
    defer wg.Done()
    fmt.Printf("Start: %v\n", time.Now())

    // Memory
    a := []string{}
    for i := 0; i < 500000; i++ {
        a = append(a, "aaaa")
    }

    // Blocking
    time.Sleep(2 * time.Second)
    fmt.Printf("End: %v\n", time.Now())
}

func main() {
    var wg sync.WaitGroup
    wg.Add(1)
    go hardWork(&wg)
    wg.Wait()
}
Now let's profile it, to do that we need to:
- Install dependencies:
apt-get install graphviz gv(debian) orbrew install graphviz(mac) - Install pprof:
go get -u github.com/google/pprof - Add an import:
import _ "net/http/pprof" - Add a server for
pprof: ```
go func() {
fmt.Println(http.ListenAndServe("localhost:6060", nil))
}()
It should look something like this:
package main
import (
"fmt"
"net/http"
"sync"
"time"
_ "net/http/pprof"
)
// Some function that does work
func hardWork(wg *sync.WaitGroup) {
defer wg.Done()
fmt.Printf("Start: %v\n", time.Now())
// Memory
a := []string{}
for i := 0; i < 500000; i++ {
    a = append(a, "aaaa")
}

// Blocking
time.Sleep(2 * time.Second)
fmt.Printf("End: %v\n", time.Now())
}
func main() {
var wg sync.WaitGroup
// Server for pprof
go func() {
    fmt.Println(http.ListenAndServe("localhost:6060", nil))
}()
wg.Add(1) // pprof - so we won't exit prematurely
wg.Add(1) // for the hardWork
go hardWork(&wg)
wg.Wait()
}
When you type: `go tool pprof http://localhost:6060/debug/pprof/heap` while the server is running (in a different terminal) and then type `png` you will get something like the following:
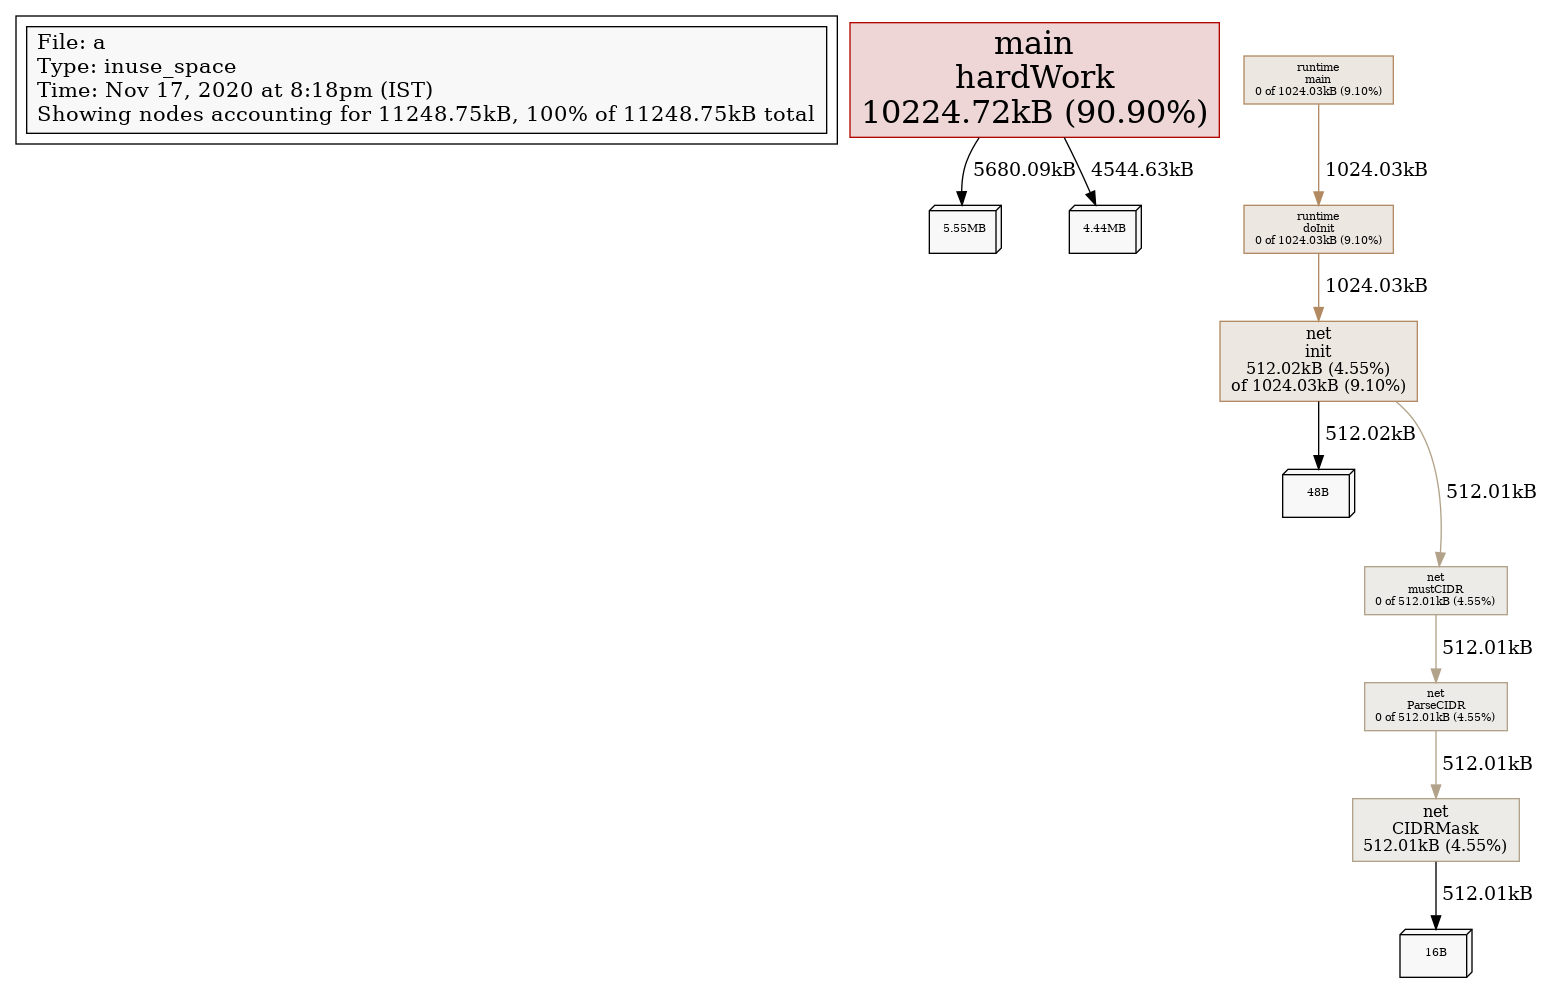
As you can see, `hardWork` is consuming some memory.
If you want to check the goroutines you can replace the line to:
`go tool pprof http://localhost:6060/debug/pprof/goroutine`
You can choose between:
- CPU: `profile?seconds=10`
- Memory: `heap`
- Goroutines: `goroutine`
- Goroutine blocking: `block`
- Locks: `mutex`
- Tracing: `trace?seconds=5`

Top comments (1)
This is great! This article helped me a lot to debug a memory leak in my application. Really appreciate the time you took to write this up. Thanks a lot :)