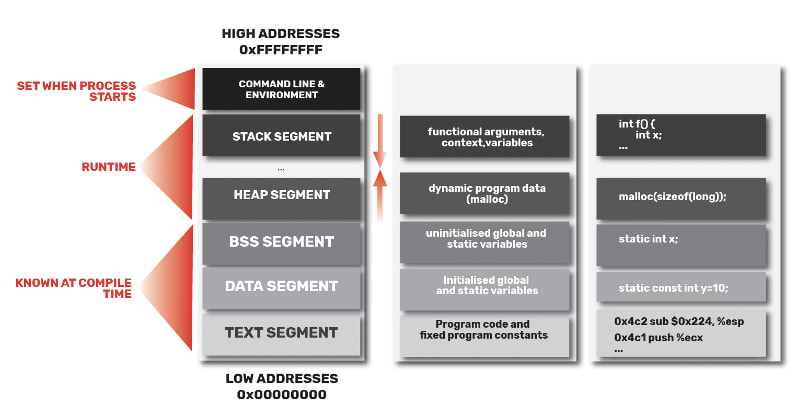
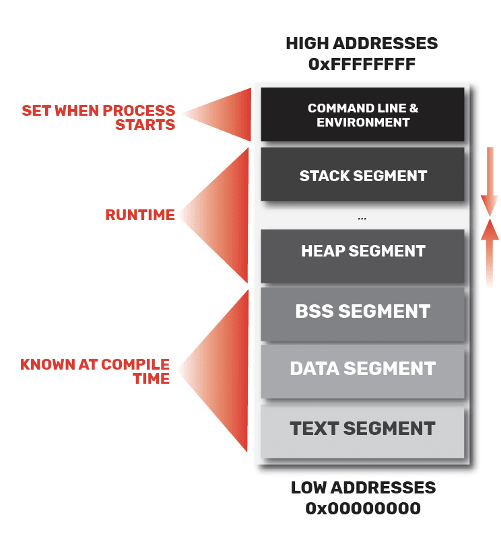
All programs are stored in memory, these are stored in virtual addresses that the OS/CPU map to physical addresses. The memory model has 5 segments and are responsible for holding memory
Stack Segment — function local variables, arguments, context
Heap Segment: dynamic program data (e.g., malloc)
Block Started by Symbol segment: uninitialized global and static variables
Data Segment: initialised global and static variables
Text Segment: program code and fixed program constants
On the third column of the diagram, we see examples of how these segments may actually look like.
Memory Allocation
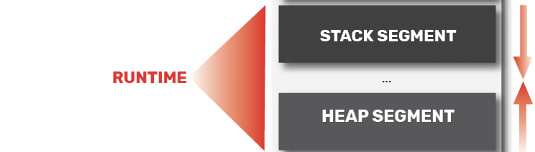
Now that we know how the memory model looks like let’s see how memory is actually allocated.
Going back to our diagram, let’s look at what happens in runtime. During runtime, the stack segment and heap segment grow in opposite directions. The heap goes from lower addresses to higher addresses and the stack segment goes from high addresses to low addresses.
Ok I get what the stack segment stores, but how does memory get allocated in the stack ?
Stack
Alright, well in computer architecture, the stack is a hardware manifestation of the data structure (Last in, First Out Queue). The stack needs to
- Call a function — As such, we need to store data
- Return from a function — As such, we need to restore data
Working Example
Stack Layout
Given the code below we want access y and increment y by 1.
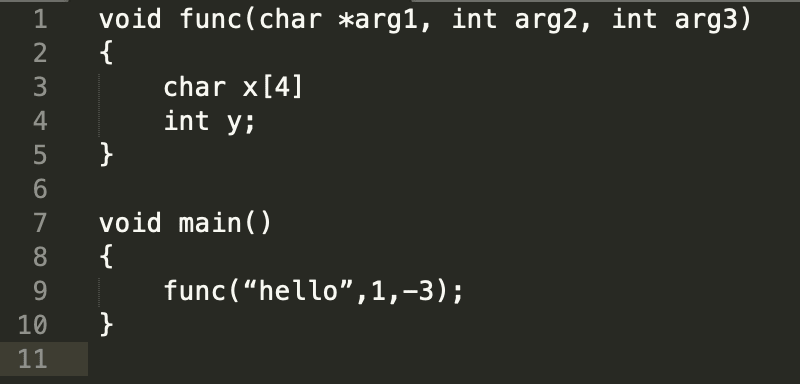

So in this example, we see that the arguments are arranged in the verse order, while the local variables are pushed in the same order they appear in the code.
Part 1: Call a Function
ESP
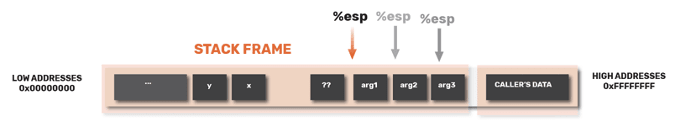
Every time, we push some data in the stack and the shrinks every time we pop something from stack. The
ESP is the Extended Stack Pointer and this register purpose is to let you know where on the stack you are. Thus, ESP always marks the top (highest point of the stack) of the stack.
EBP
In order to increment y, we need to know where y is stored in the stack. However, it’s difficult to know what y’s address is in compile time
For example, if y is stored in 0xbfff333, in the next time the function is called y can be stored in a totally different address (e.g. 0xbfff9F3).
Oh no, So how do we locate y?
Well luckily, we can use %ebp as an anchor point to find these variables. The EBP formally defined as the Extended Base Stack Pointer and its purpose is to point to the base address of the stack.
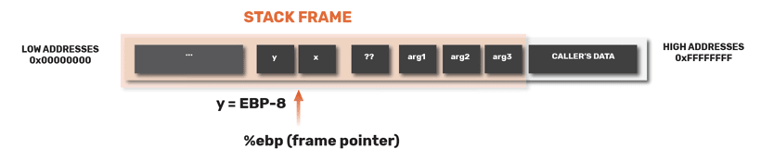
Based on the diagram above, let’s say that y is 8 bytes before EBP. So now the compiler will know that whenever this function is called, y will be 8 bytes before the EBP
Part 2: Return from a Function
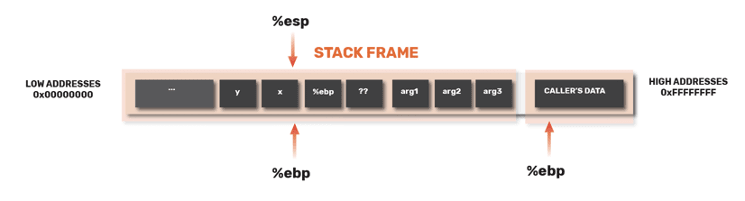
So for example, when %esp has finally reached %ebp, we can
- push %ebp before local variables and
- then set %ebp to the current %esp and
- then set %ebp to the %ebp at return
In simple terms, we have saved the frame pointer in the stack.
Afterwards, we have updated the frame pointer to be the current stack pointer.
Now, when the func functions starts to run, it will push its local variables after the stack pointer.
How do we continue our operations in main?

Now that we have called the function and returned, how do make the sure the program continues to run? This is where EIP comes in handy.
EIP is formally defined as the Extended Instruction Pointer. It is a read-only register and it contains the address of the next instruction to read on the program, point always to the “Program Code” memory segment.
So, when main is running it moves the EIP up the main function. When it hits 0x*8048455, it calls func. When it goes to call it, the EIP goes to func at 0x*804840b. Let’s see how this looks like in the stack layout

So looking at the stack layout, we see that EIP is EBP+4. As such, when we are done we will just need to set the current frame pointer (EBP) to 4 from the callee (in the caller’s data).
Afterwards, we can just return to the main function and continue where we left off.
References
Mercolino. (2014). Understanding Buffer Overflows Attacks. Retrieved from https://itandsecuritystuffs.wordpress.com/2014/03/18/understanding-buffer-overflows-attacks-part-1/

Top comments (0)