Today, we will dive into one of the hard parts of using any monitoring - making sense out of all the data that is emitted. We think this is one of the hard parts. And being developers building for developers, we think a lot like you do -- we think. Pun intended.
Nowadays, we monitor AppSignal with AppSignal (on a separate setup), so we are still dogfooding all the time. We still run into challenges as you do, often before you.
Magic Dashboards
We believe one of the harder challenges is finding the right data and making sense of it. Once we discover what works best for a certain setup, we don't just keep the solution to ourselves, we make it into a solution that's available to all of our users.
We call this solution Magic Dashboards. Based on the architecture that you are running, we add dashboards that make sense for that architecture.
If you are running a recent version of the AppSignal integration, magic dashboards will show up when you add a new application.
Erlang VM Magic Dashboard
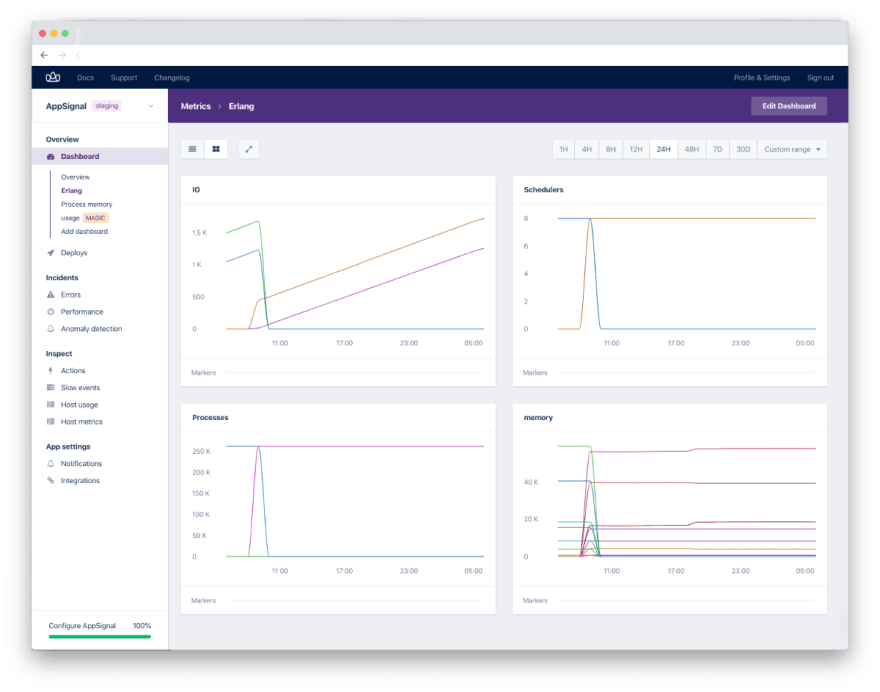
A Magic Dashboard that we made for the Elixir integration is the Erlang VM dashboard. It has graphs metrics on IO, schedulers, processes and memory. This is what it looks like:
IO
This shows the amount of input and output you have cumulatively, expressed in kb.
Schedulers
This graph shows the total number of available schedulers and the number of online schedulers. Erlang's schedulers schedule CPU time between your processes. The number of schedulers defaults to the number of CPU cores on the machine.
If you want to know more about schedulers, here’s a good article on Hamidreza Soleimani’s Blog on why the details of schedulers are important.
Processes
The number of processes and the limit are plotted here. The limit is the maximum number of simultaneously existing processes at the local node. If you reach the limit, the process will raise an exception. But the default Erlang limit is 262144, which should be high enough for almost all applications.
Memory
This shows the total amount of memory that is used as well as its usage, split into processes, system, binary, ets and code.
The level that is considered normal, obviously depends on your situation. But when this suddenly goes up, it might be an indicator that something is wrong.
For anything that's monitored on a dashboard, you can set up triggers (which we call ‘anomaly detection’), that will message you via email/slack/PagerDuty when it goes over a normal value for your case, for a certain period. Our Documentation on Anomaly Detection describes how to set that up.
Dashboards for Host Metrics
Apart from the things that you are running in your Elixir setup, when you have AppSignal running, we also immediately add dashboards and metrics for your hosts.
For example, check the ‘Host usage’ link in the Inspect menu item to see throughput, response time and queue time for any Namespace on that Host. And check the 'Host Metrics' to see CPU, Disk usage, Load average and more for each of the Hosts.
We've seen that the integrated approach of monitoring really helps in narrowing down what causes issues. So for each of these metrics, you can click on a peak, check 'what happened here' in the graph legend and see the entire overview of errors, performance issues and host metrics.
Edit or Extend as You Want
We always mix having loads of insight out-of-the-box with being able to tweak things exactly as you want. So if you want to have any of these dashboards set up differently, you can edit the dashboard configuration YAML and make it do exactly what you want.
What More Do You Want Us to Add?
We are always curious to hear what else you’d like us to set up Magic dashboards for. So if you have something in your Elixir setup that you want us to help visualize in a graph, drop us a line at support@appsignal.com. We'll then let everyone else have it magically.
PS: Another hard part about monitoring is digesting the hundreds of billions of requests that you may emit. We might write a blog post about that another day ;-) It's why we think you should use a dedicated service rather than run it yourself. And if you'd try us we'd be honored.


Top comments (0)