

What?
Have you ever wondered what is going on inside your program? Wanted a visual way to inspect its inner workings?
The gif above shows an example of Llama Logs. It is a new tool I created to let you see the inner workings of your applications in real time. It is ready for you to start using in your app for free today!
Below I will walk through an example of using Llama Logs to show and debug errors in a basic express app as they happen.
The Setup
I am going to write a basic express app that takes in a user's email through a url param and saves it to the database if the email is a llamalogs.com domain.
The basic logic will look like this
app.get('/', (req, res) => {
  let customerEmail = req.query.email
  let isDomainOk = domainCheck(customerEmail)

  if (isDomainOk) {
      saveEmail(customerEmail)
  }

  res.send('We received your email')
})
Now the doozy is that I am going to write some horrible code that errors if the user forgets to include the @domain part of their email.
const domainCheck = (customerEmail) => {
  // toLowerCase will fail if the [1] value is undefined!
  const domain = customerEmail.split("@")[1].toLowerCase()
  const domainIsOk = domain === "llamalogs.com"
  return domainIsOk
}
Visualizing with Llama Logs
Llama Logs is incredibly simple to set up. Once you sign up on llamalogs.com, all you need to do is install the client via npm and then start logging. Llama Logs will automatically turn your logs into an interactive graph.
So for example lets update the domainCheck method to the following
const domainCheck = (customerEmail) => {
  try {
    const domain = customerEmail.split("@")[1].toLowerCase()
    const domainIsOk = domain === "llamalogs.com"

    LlamaLogs.log({ sender: 'Server', receiver: 'Domain Check' })

    return domainIsOk

  } catch (e) {
    LlamaLogs.log({
      sender: 'Server',
      receiver: 'Domain Check',
      message: `input: ${customerEmail}; Error: ${e}`,
      isError: true
    })
  }
}
So we have added a logging case for both the success and failure outcomes. Llama Logs will then use the names provided in the "sender", "receiver", and "isError" attributes to automatically visualize the activity in your app as a series of points moving between components.
In the graph below we can see the result of running a few calls to the server with valid emails and ones that cause errors.
Debugging
Even better than visualizing the activity in the graph, Llama Logs will let you get data from your errors in real time.
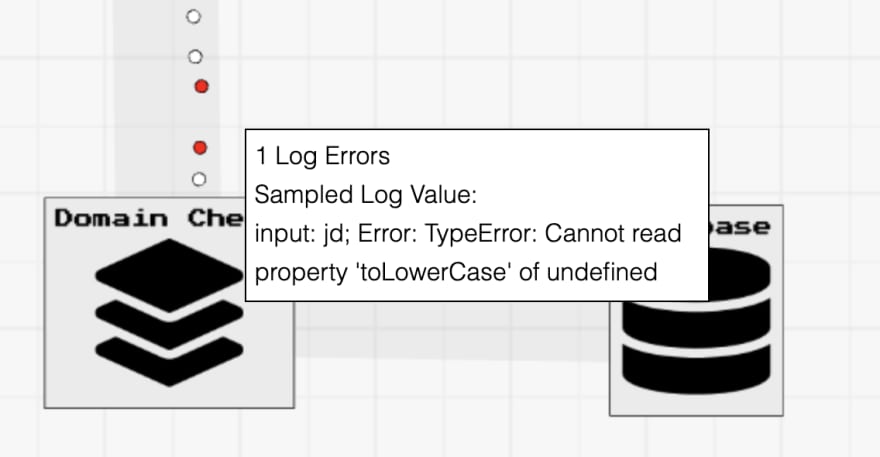
Remember in the domainCheck method we attached this attribute to the Llama Log?
message: `input: ${customerEmail}; Error: ${e}`,
By using this message attribute, that means that when we hover on the red error point, it will show the message. The image below comes shows me hovering on an error. The request it represents had the email param == "jd", missing the email domain.
By using Llama Logs to visualize errors in your system, you can identify the sources of bugs faster and easier than ever before!
More Info
Please visit LlamaLogs.com for more information if you are interested. The app is free and ready to use today. Please feel free to contact me at andrew@llamalogs.com if you have any questions.
Full Code
This is such a small express app I think it is easiest to include all of the code within this blog post.
const express = require('express')
const { LlamaLogs } = require('llamalogs');

LlamaLogs.init({
    accountKey: 'YOUR_ACCOUNT_KEY',
    graphName: 'YOUR_GRAPH_NAME'
});

const app = express()
const port = 3000

app.get('/', (req, res) => {
  LlamaLogs.log({ sender: 'User', receiver: 'Server' })

  let customerEmail = req.query.email
  let isDomainOk = domainCheck(customerEmail)

  if (isDomainOk) {
      saveEmail(customerEmail)
  }

  res.send('We received your email')
})

app.listen(port, () => {
  console.log(`Example app listening at http://localhost:${port}`)
})


const domainCheck = (customerEmail) => {
  try {
    const domain = customerEmail.split("@")[1].toLowerCase()
    const domainIsOk = domain === "llamalogs.com"

    LlamaLogs.log({ sender: 'Server', receiver: 'Domain Check' })

    return domainIsOk

  } catch (e) {
    LlamaLogs.log({
      sender: 'Server',
      receiver: 'Domain Check',
      message: `input: ${customerEmail}; Error: ${e}`,
      isError: true
    })
  }
}

const saveEmail = (customerEmail) => {
    // pretend we are saving to a database here
    LlamaLogs.log({ sender: 'Domain Check', receiver: 'Database' })
}

Latest comments (3)
Very nice , I wonder how will be the graph in very big apps where there are a lot of routes, functions ! Time to try now.
Thanks
You can zoom in and out in the client, so it should be able to handle a pretty huge graph. Also you could separate the one large graph into smaller separate graphs with different names. Let me know how it goes. Thank you for checking it out!
Hey, what's your twitter
Some comments may only be visible to logged-in visitors. Sign in to view all comments.