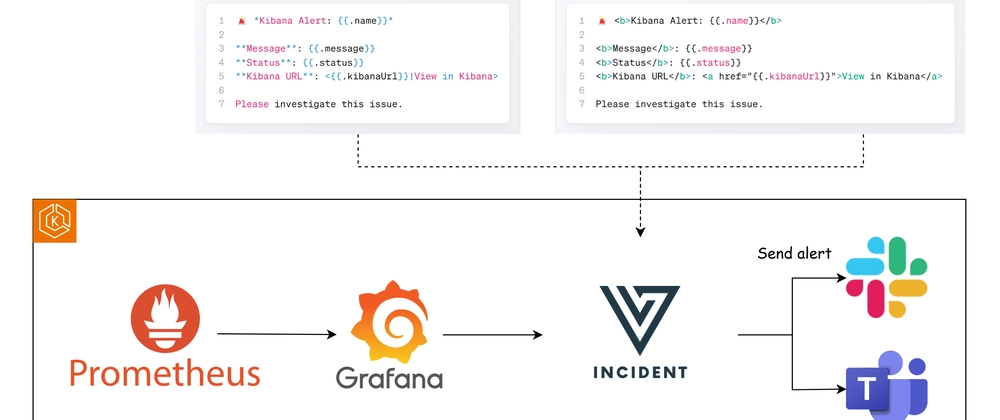
This guide leverages Versus Incident as an intermediary to route Grafana alerts to both Slack and Telegram with customizable messages, using a real-world JSON payload from Grafana.
Grafana is a powerful platform for monitoring and observability, with robust alerting capabilities. By integrating it with Versus Incident, you can extend its notification options to Slack and Telegram with tailored messages.
In this guide, we’ll configure Grafana to send alerts to Versus Incident based on a sample JSON payload, then forward them to Slack and Telegram.
Prerequisites
- A running Grafana instance (version 8.0+ recommended for unified alerting) connected to a data source (e.g., Prometheus).
- A Slack workspace with permission to create a bot and obtain a token.
- A Telegram account with a bot created via BotFather and a chat ID for your target group or channel.
- Docker installed (optional, for easy Versus Incident deployment).
Step 1: Set Up Slack and Telegram Bots
Slack Bot
- Visit api.slack.com/apps and click Create New App.
- Name your app (e.g., “Grafana Alerts”) and select your Slack workspace.
- Under Bot Users, add a bot (e.g., “GrafanaBot”) and enable it.
- Go to OAuth & Permissions, add the
chat:writescope under Scopes. - Install the app to your workspace and copy the Bot User OAuth Token (starts with
xoxb-). Save it securely. - Invite the bot to your Slack channel by typing
/invite @GrafanaBotand note the channel ID (right-click the channel, copy the link, and extract the ID).
Telegram Bot
- Open Telegram, search for BotFather, and start a chat.
- Type
/newbotand follow the prompts to name your bot (e.g., “GrafanaAlertBot”). - BotFather will provide a Bot Token (e.g.,
123456:ABC-DEF1234ghIkl-zyx57W2v1u123ew11). Save it securely. - Create a group or channel, add your bot, and get the Chat ID.
Step 2: Deploy Versus with Slack and Telegram Enabled
Versus Incident will process Grafana’s JSON payload and route alerts to Slack and Telegram.
Create a configuration directory:
mkdir -p ./config
Create config/config.yaml with the following content:
   name: versus
   host: 0.0.0.0
   port: 3000

   alert:
     slack:
       enable: true
       token: ${SLACK_TOKEN}
       channel_id: ${SLACK_CHANNEL_ID}
       template_path: "/app/config/slack_message.tmpl"

     telegram:
       enable: true
       bot_token: ${TELEGRAM_BOT_TOKEN}
       chat_id: ${TELEGRAM_CHAT_ID}
       template_path: "/app/config/telegram_message.tmpl"
Create a Slack template at config/slack_message.tmpl, tailored to the JSON structure:
   🚨 *Grafana Alert: {{.alerts.[0].labels.alertname}}*

   **Message**: {{.message}}
   **Status**: {{.status}}
   **Instance**: {{.alerts.[0].labels.instance}}
   **Severity**: {{.alerts.[0].labels.severity}}
   **Grafana URL**: <{{.alerts.[0].generatorURL}}|View in Grafana>

   Please investigate this issue.
Create a Telegram template at config/telegram_message.tmpl (using HTML formatting):
   🚨 <b>Grafana Alert: {{.alerts.[0].labels.alertname}}</b>

   <b>Message</b>: {{.message}}
   <b>Status</b>: {{.status}}
   <b>Instance</b>: {{.alerts.[0].labels.instance}}
   <b>Severity</b>: {{.alerts.[0].labels.severity}}
   <b>Grafana URL</b>: <a href="{{.alerts.[0].generatorURL}}">View in Grafana</a>

   Please investigate this issue.
Deploy Versus using Docker:
   docker run -d \
     -p 3000:3000 \
     -v $(pwd)/config:/app/config \
     -e SLACK_TOKEN="your_slack_bot_token" \
     -e SLACK_CHANNEL_ID="your_slack_channel_id" \
     -e TELEGRAM_BOT_TOKEN="your_telegram_bot_token" \
     -e TELEGRAM_CHAT_ID="your_telegram_chat_id" \
     --name versus \
     ghcr.io/versuscontrol/versus-incident
- Replace
your_slack_bot_tokenandyour_slack_channel_idwith Slack values. - Replace
your_telegram_bot_tokenandyour_telegram_chat_idwith Telegram values.
The Versus Incident API endpoint is available at:
http://localhost:3000/api/incidents
Use ngrok to expose it to the internet:
ngrok http 3000 --url your-versus-https-url.ngrok-free.app
Step 3: Configure Grafana Alerts with a Webhook
Grafana’s unified alerting system sends JSON payloads like the one provided. We’ll configure a webhook to send this data to Versus Incident.
Log in to Grafana and go to Alerting > Alert rules.
-
Create a new alert rule:
- Name: “HighCPUUsage”.
- Data source: Select your data source (e.g., Prometheus) and define a query (e.g.,
cpu_usage > 90). - Condition: Set a threshold, such as “value is above 90” over the last 5 minutes.
- Evaluation: Check every 1 minute.
-
Add a notification channel or contact point:
- Type: Webhook.
- URL:
https://your-versus-https-url.ngrok-free.app/api/incidents. - HTTP Method: POST.
- Headers: Add
Content-Type: application/json. - Body: Grafana automatically sends a JSON payload like this:
 {
   "receiver": "webhook",
   "status": "firing",
   "alerts": [
     {
       "status": "firing",
       "labels": {
         "alertname": "HighCPUUsage",
         "instance": "server-01",
         "severity": "critical",
         "team": "ops"
       },
       "annotations": {
         "summary": "CPU usage is above 90% on server-01",
         "description": "The CPU usage on server-01 has exceeded 90% for more than 5 minutes."
       },
       "startsAt": "2025-03-25T06:25:00.000Z",
       "endsAt": "0001-01-01T00:00:00Z",
       "generatorURL": "http://grafana.example.com/alerting/1/view",
       "fingerprint": "a1b2c3d4e5f6g7h8"
     }
   ],
   "groupLabels": {
     "alertname": "HighCPUUsage"
   },
   "commonLabels": {
     "alertname": "HighCPUUsage",
     "severity": "critical"
   },
   "commonAnnotations": {
     "summary": "CPU usage is above 90%"
   },
   "externalURL": "http://grafana.example.com/",
   "version": "1",
   "groupKey": "{}:{alertname=\"HighCPUUsage\"}",
   "truncatedAlerts": 0,
   "orgId": 1,
   "title": "[Firing:1] HighCPUUsage (critical)",
   "state": "alerting",
   "message": "CPU usage is above 90% on server-01"
 }
- No custom body is needed, as Grafana’s default payload matches Versus Incident’s expectations when paired with the templates.
Save the alert rule and notification settings.
Step 4: Test the Integration
Simulate a Grafana alert using curl with the provided JSON:
curl -X POST http://localhost:3000/api/incidents \
  -H "Content-Type: application/json" \
  -d '{
    "receiver": "webhook",
    "status": "firing",
    "alerts": [
      {
        "status": "firing",
        "labels": {
          "alertname": "HighCPUUsage",
          "instance": "server-01",
          "severity": "critical",
          "team": "ops"
        },
        "annotations": {
          "summary": "CPU usage is above 90% on server-01",
          "description": "The CPU usage on server-01 has exceeded 90% for more than 5 minutes."
        },
        "startsAt": "2025-03-25T06:25:00.000Z",
        "endsAt": "0001-01-01T00:00:00Z",
        "generatorURL": "http://grafana.example.com/alerting/1/view",
        "fingerprint": "a1b2c3d4e5f6g7h8"
      }
    ],
    "groupLabels": {
      "alertname": "HighCPUUsage"
    },
    "commonLabels": {
      "alertname": "HighCPUUsage",
      "severity": "critical"
    },
    "commonAnnotations": {
      "summary": "CPU usage is above 90%"
    },
    "externalURL": "http://grafana.example.com/",
    "version": "1",
    "groupKey": "{}:{alertname=\"HighCPUUsage\"}",
    "truncatedAlerts": 0,
    "orgId": 1,
    "title": "[Firing:1] HighCPUUsage (critical)",
    "state": "alerting",
    "message": "CPU usage is above 90% on server-01"
  }'
Alternatively, trigger a real alert in Grafana and verify the notifications in Slack and Telegram.
Conclusion
By integrating Grafana with Versus Incident, you can send detailed alerts to Slack and Telegram using Grafana’s native JSON payload. The setup is flexible, allowing you to customize templates to extract fields like alertname, instance, and severity.
Versus Incident also supports additional channels (e.g., Microsoft Teams, Email) and integrations like AWS Incident Manager. Check the Versus Incident documentation for more options to enhance your alerting workflow.

Top comments (0)