
This is the transcript from the talk Monitoring Production Methodologically that we gave at Despegar on June 11, 2020. For the past 5 years we have worked together on different projects in which, apart from our work as developers, we've tried different tools and techniques to monitor the apps in production. This talk includes many lessons and techniques learned during these years.
English version
for spanish version follow this link
Date: 06/11/2020
Authors:


This is an edited and synthesized transcript of the talk Monitoring Production Methodologically we gave at Despegar on June 11, 2020. In the Last 5 years we have worked together on different projects as developers, and along the way, we have researched and tested different tools and techniques to monitor apps. This talk includes many lessons and techniques learned during these years.
Transcript:

This is a talk about the aspects and lessons to take into account when building a monitoring system.

These are some of the questions that we may want to answer when we are in charge of keeping our apps running on production. We will try to deepen the subject from a practical point of view. Although we will show examples with some specific tools, the focus will be on talking about the guidelines and aspects to consider, not on which tool we can use.
The ideas we are sharing on this talk are aspirational, that is, guidelines to achieve a successful monitoring system. Then each one will have to analyze and decide what is the most convenient way to take it to their own system.

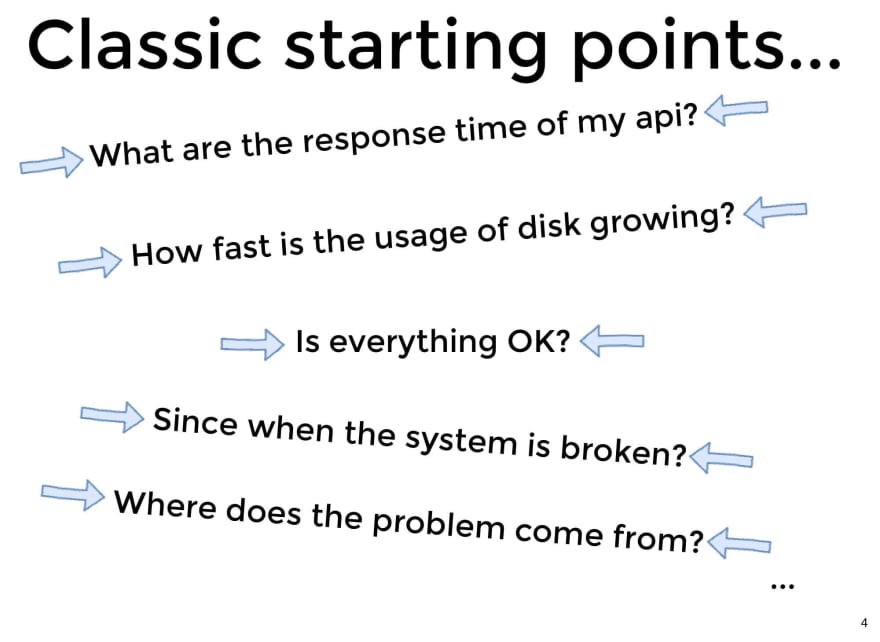
At some point we surely did questions like these, which were triggers to start thinking about how to build or choose a monitoring system for our applications.
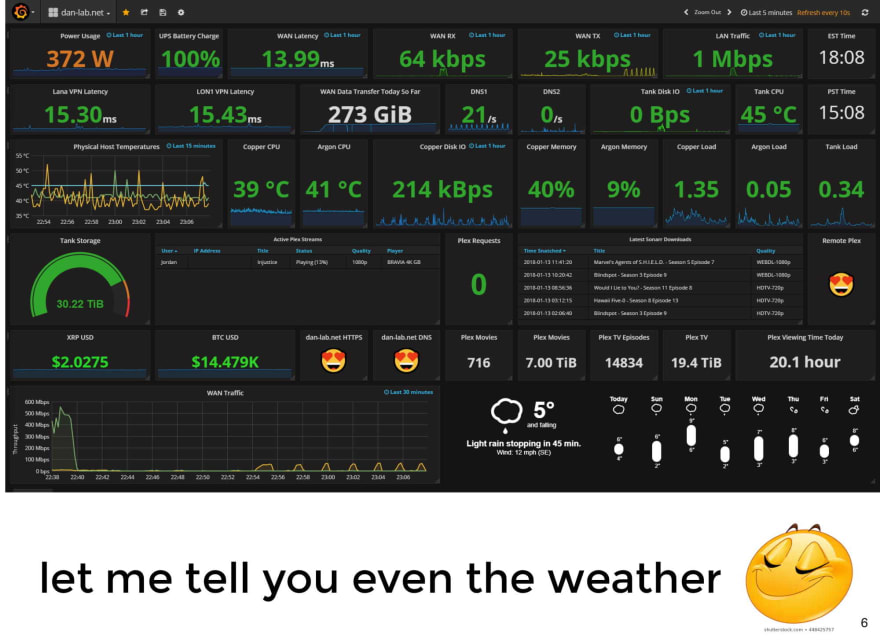
And it's possible that after a good effort, we've managed to answer all the questions, and even along the way many more metrics added up. As in this example, in which "just, because we can ...", we added the weather and the weather forecast.

While that dashboard may seem very comprehensive, how effective is it at solving problems in production? Is it useful for troubleshooting or understanding what's going wrong?
What happens many times, is that we end up with dashboards that are like a long sheet, full of metrics of all kinds. And then, in the middle of a production problem, we go crazy trying to figure out what graph to look at and what information they are showing us.


So what questions really matter? Which ones should we respond with our monitoring system?
There are 2 key questions you should answer: what’s broken and why.
These two questions should guide our monitoring system.
When we try to answer what is broken, we are talking about the symptoms that our system presents, which is equivalent to the impact that we are generating on users (being people, or other applications).
When we try to answer why that symptom occurred, we are talking about the cause.
Cindy Sridharan, in a post about Monitoring And Observability says that our monitoring system should make visible or evident what is the impact that we are generating on our users (what’s broken), as well as the effect of any fix deployed.
Here we leave a link to chapter 6 of the SRE Google book, from where we extracted this first guideline, regarding what and why. And next, let's focus on how these two questions can guide the design of our monitoring system.
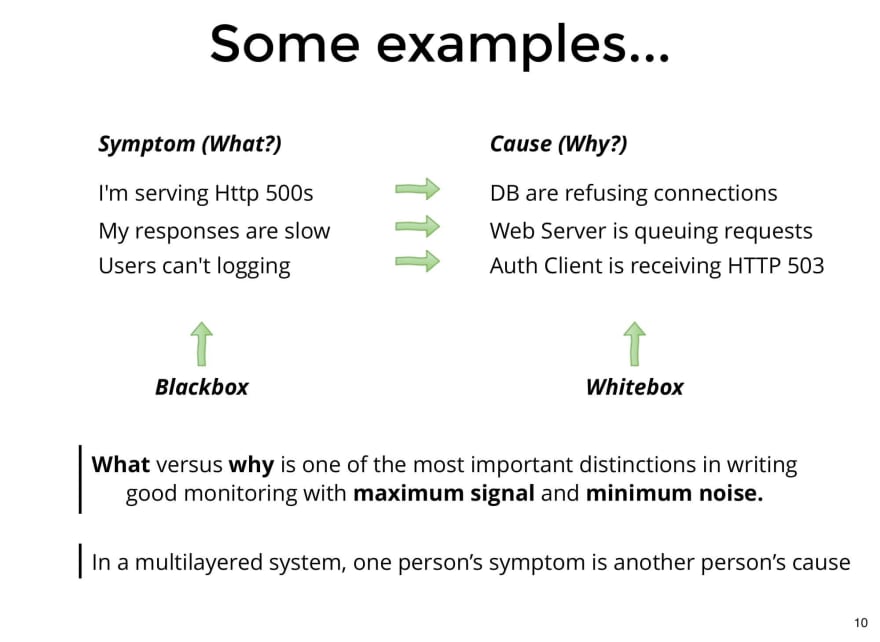
For clarity, let's look at 3 simple examples of Symptoms Vs. Causes.
- In the first case, we have an
APIthat responds500s. The symptom, that is, what is perceived externally, and therefore, the way we are impacting the user, is the fact of returning500s. While the cause in this case is that the Database rejects the connections. - In the second case, the
APIis responding, but slower than expected. That is the symptom that can be observed externally. While the cause is that requests are being queued. It is an intermediate cause, it would be necessary to analyze why they are queuing. - In the third case, the symptom is that users cannot login, and the cause is that the authentication client is receiving
503.
Those who capture the symptoms are called "black box monitoring", since we are obtaining an external view of the system. While those that capture internal system events are called "white box monitoring", and they generally allow us to understand the cause.
*Distinguishing between what and why allowes us to design monitoring systems with clearer signals and less noise *. This quote is taken from the Google SRE book.
Someone could have noticed that the causes of our system could be one symptom in another. That is the case of the third example, where we have a client that receives 503, which is a cause in our system and a symptom on the other side, in the service that handles these requests.
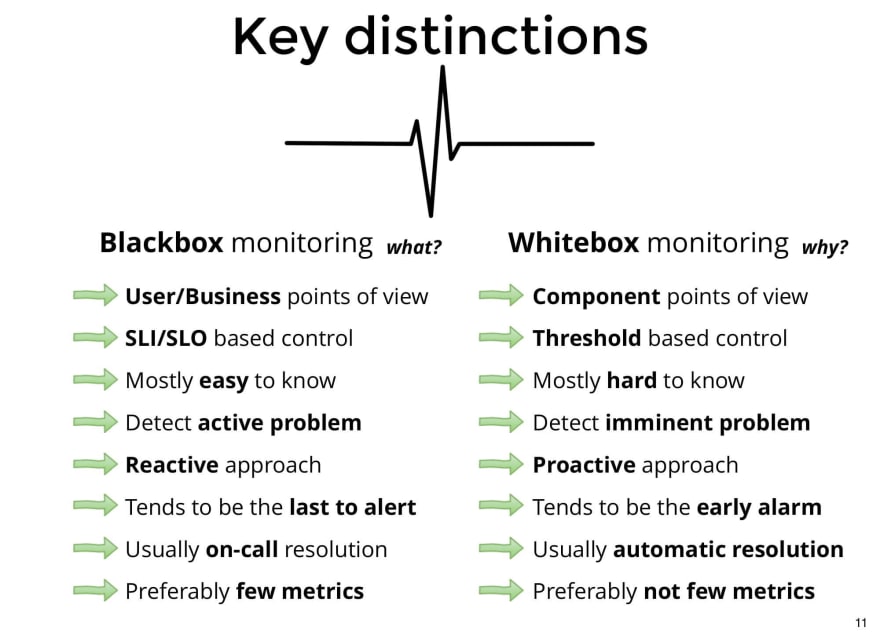
There are key differences between black box monitoring and white box monitoring. Knowing them can help us to develop more effective charts and panels that focus on what they are trying to show, either a symptom or a cause.
In the case of black box:
- Monitoring must be thought from the user's point of view (or, from the business requirements). For example, questions like How fast do users expect my API to respond to them?, would lead us to make a graph of response times.
- They are usually controlled through SLIs and SLOs (later we will see what they mean).
- They are relatively easy to know, since in general the requirements that the service tries to satisfy are known in advance.
- This type of system allows us to visualize active problems, that is, they are already occurring and impacting the user.
- This means that we must act reactively: when the problem are already impacting users.
- In general, alerts from a black box monitoring system tend to be the last to be on fired.
- They are usually resolved by the people who are on call.
- And they are generally made up of few metrics, since the users typically doesn't expect very complex things from our services, they just want it to work under appropriate response times, in an appropriate way, with no errors, etc.
In the case of white box:
- Monitoring must be thought from a very technical point of view, based on the architecture of our service.
- They are generally controlled by thresholds, within which we can affirm that our components will work well.
- In general, it is more difficult to know what we are interested in monitoring, and how, since it depends on technical knowledge and experience about the components of the system.
- They detect imminent problems, that is, they may not have produced any consequences yet, but if they continue in this way, they will soon.
- They allow you to act proactively, since they allow you to anticipate the symptoms that are about to occur. For example, if we see that the disk space passed a threshold, we can affirm that if we continue in this way, we will soon run out of disk, which may be something that generates some impact on the user, and therefore we can react early, preventing the problem of running out of disk.
- In general, it tends to have early alarms, which can prevent incidents.
- There are usually automatic solutions, for example, autoscaling, automatic rollback, circuit breaker, etc.
- And here we do want to have as many metrics as the system needs to verify that it is in an acceptable state.
Among all these differences, there is one that is key: the approach to dealing with problems. While in a black box one, the approach is reactive (i.e. we react when the user is being affected), in a white box one, we can act proactively, before the user is affected.
Both types of monitoring are important and complement each other.


Here are some good practices that we were incorporating.
- Simplicity is the main optimization of any system. The monitoring system is like any other software system, it can easily become complex and unmanageable, among other deficiencies. Keeping things simple helps make it easy to understand, maintain, and modify.
- It should be easy to read and understand. In other words, has to be expressive.
- Do not disaggregate unnecessarily. For example, if I am measuring times, choose appropriately 3 or 4 percentiles, if I want to measure errors, choose how to count them, either counting the number of errors or counting the success, and count only one, etc.
- Keep charts clean and tidy.
- Metrics and alerts that we rarely use are candidates for deletion. Or, we should think about what changes need to be made to make it more relevant.
- If possible, have few metrics, and do not duplicate them. Sometimes we have the same metric taken with different systems. Avoid redundancy, or you may not know what to look at.
- Pay special attention to how we are measuring. In general, using time series, which allow graphing continuous lines, is preferable to making discrete checks, as we would do with
Nagiosfor example. - Avoid averages. Mainly when we are measuring response times. It is preferable to save the times in buckets, and visualize the distribution, for example, percentile 50 / 75 / 90 / 99 / 99.9 / etc. Also keep in mind how the buckets are configured, and if they are according to the times we want to record.
- Keep an eye on the outliers, for example the 99.9 percentile, or 99.99 percentile (or more, that depends on the service we are analyzing). It is important not to forget about these peaks, which depending on the amount of traffic, can be significant.
- Appropriately select the resolution, according to what we are measuring. Most of the time, the default that the tools bring, doesn't match with our needs.
Now we are going to show two of the most used methodologies to monitor.

USE Method is a methodology created by Brendan Gregg, a industry expert in computing performance. It's a methodology oriented to performance analysis, focused on analyzing 3 aspects of each resource: Utilization, Saturation and Errors. He says that analyzing these 3 aspects of each resource, we can solve 80% of the cases.
- Utilization is the average time that the resource was busy servicing work.
- Saturation can be seen as a queue of tasks to be dispatched by the resource. The number of tasks that are queued represents the degree of saturation of the resource.
- Errors, that is, number of resource failures. It can be counted as a ratio of type
errors / total requests.
Although this methodology was created for performance analysis, it can be used as a guide to create our white box monitoring system, since we could analyze these 3 characteristics in each component / resource that we are interested in monitoring.
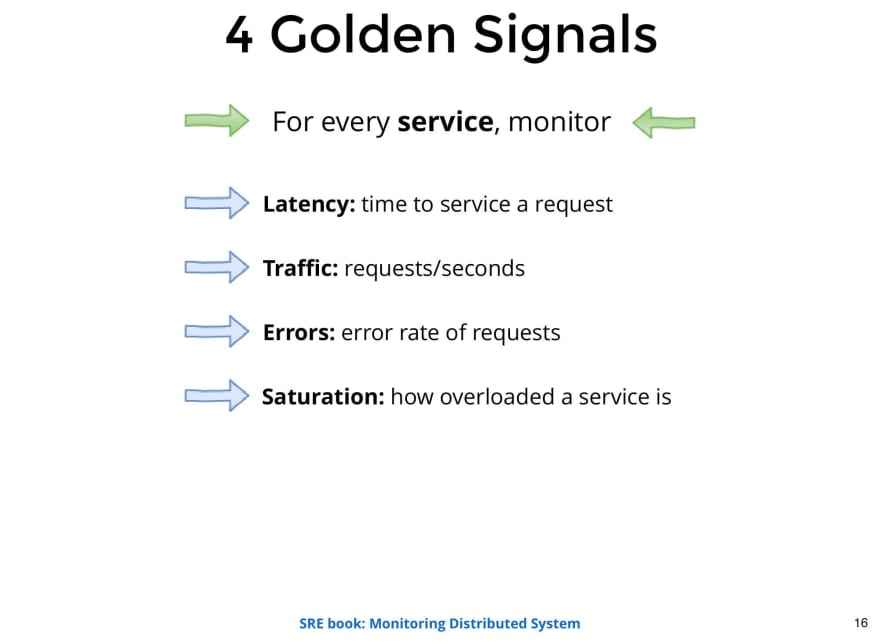
The Four Golden Signal is a methodology presented by Google in its SRE book. In this book they say that if you could only measure 4 metrics of your service, it should be latency, throughput, errors and saturation. Those metrics are enough to detect most problems.
It is a methodology for developing black box monitoring.
- Latency, is the time it takes it to do something requested by the user. In general it is the time it takes to answer a request, or the lag in a data pipeline.
- Throughput is the number of requests we are receiving. It's important to watch traffic, because it should always change as expected. If it changes unexpectedly, it could be a sign that someone put us on a blacklist, or that they are not being able to consume our service.
- Errors. It is always important to know how many errors we have and if we are under an acceptable number of errors.
- Saturation, How stressed is our service? This metric can be made up of different aspects of our system. It depends on the type of service we are studing. It could be the number of requests queued or some other thing.
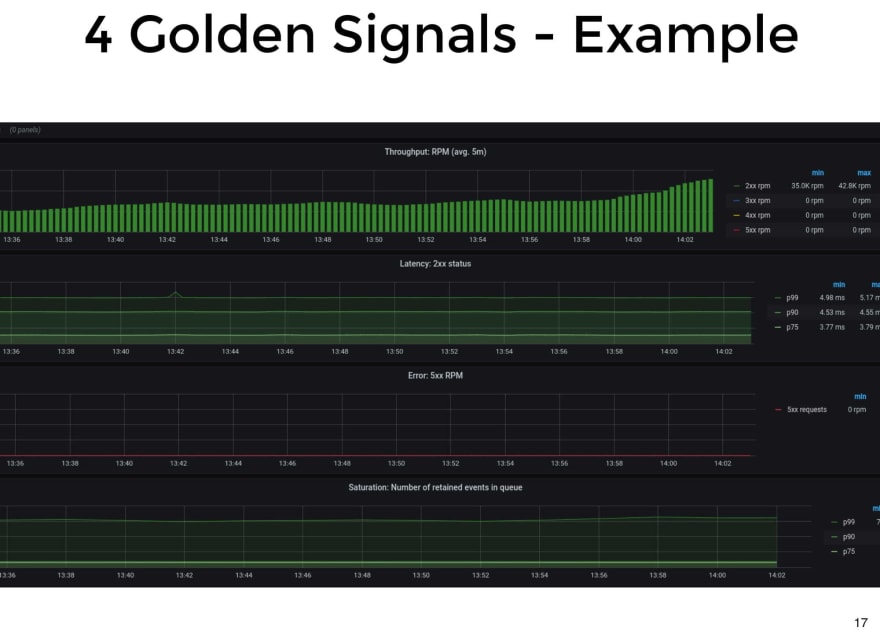
This is an example of one of our services, monitored with The Four Golden Signals. In the case of this application, as it does an asynchronous processing of the events it receives, an indicator that the service is saturated is the number of events we are holding in the queue.

We also can take some ideas and practices from SRE, since monitoring is a core part of this role.
Of course, SRE is much more than monitoring applications, not to mention if we take into account how Google applies it. Being aware that we are not Google, nor Twitter, nor Netflix, we do believe that we can take some ideas from these practices and bring it to our reality.
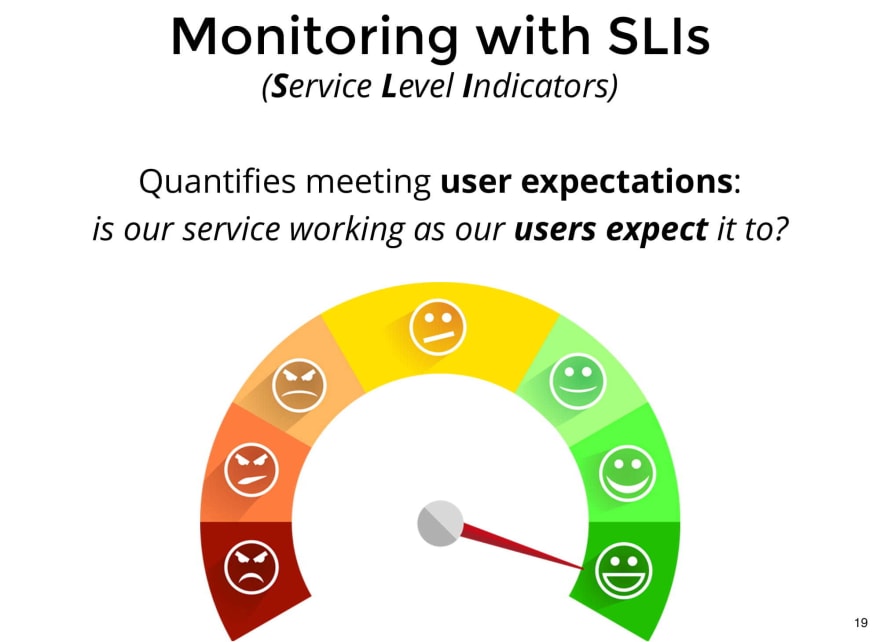
One of the main goal of SRE is to measure how well user expectations are being met. To be able to quantify it objectively, they select a series of key indicators, called SLI (Service Level Indicator), to measure whether the quality of service that is intended to be provided is being met.

At Google, there is a "SLI menu", which has a list of SLIs to apply to each type of service, depending on how the service interacts with users. For example, in a service where users interact through a Request / Response scheme, 3 key SLIs would be availability, latency and quality of responses. Quality can be an interesting metric if we have some graceful degradation mechanism. Similarly, if we have a service that works as a data pipeline, where users push an event for it to be processed and made available, we'll be interested in observing other types of indicators, and so on.
The menu serves as an initial guide, then you have to analyze the particular needs of your service.
So, the way to appropriately choose the SLIs for my service would be as follows:
- The first step is to choose the suitable SLIs for the service I want to monitor.
- The second step is to specify which events we are going to consider valid for the SLI, and what condition they must meet to be counted as successful or good events.
- Finally, as a third step, we should specify where we are going to obtain these events, basically how close to the user or how close to the apps we are going to be.
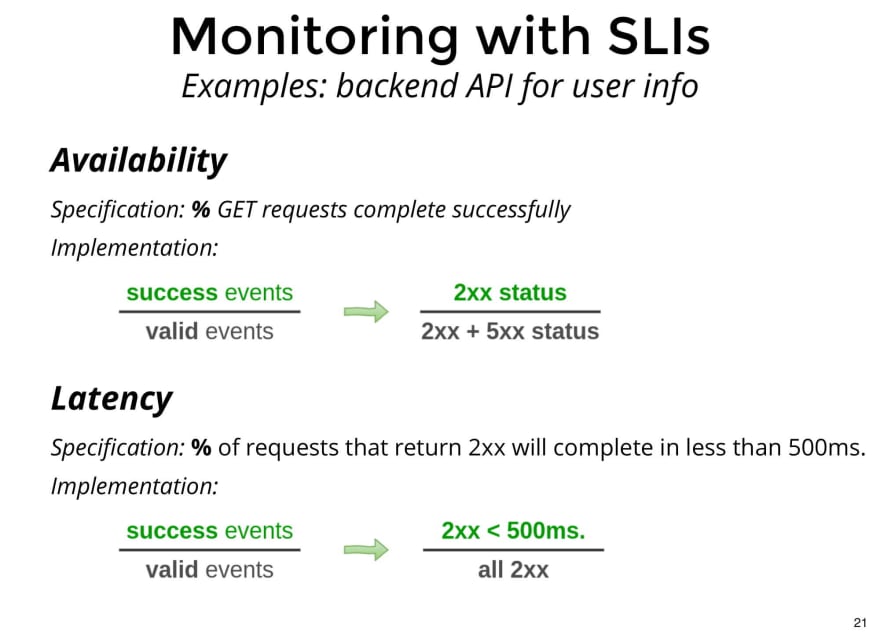
Here's an example of how we could add 2 SLIs to measure availability and latency of a service that exposes user information.
In the case of Availability, we can specify that we want to observe the percentage of GETs that are completed successfully, and as an implementation, we can specify that we will record as valid events all the requests that return 200s or 500sas status code, and as successful events, those that return 200s. So, we can make a ratio of quantity of 200s over quantity of 200s + 500s, obtaining the percentage of GETs completed successfully.
For latency, we can specify that we are interested in measuring the percentage of requests that return a 200s as status code, in less than 500 milliseconds. As an implementation, we can specify that valid events are all 200s, and successful events are 200s that resolve in less than 500 milliseconds.

It turns out that by defining valid events and successful events for each SLI, we can take all measurements in a common unit, in percentages. Then, since they are percentages, we can easily set targets on them. These objectives are called SLO (Service Level Objective), and they must have a time window on which they will be measured. For example, for availability we can establish an SLO of 99.9%, measured through all the servers that expose the service, and in time windows of 24 hours. Similarly, we can define another SLO for latency, defining that we want at least 95% of the GET requests that end with 200s, to be completed in less than 500ms, measured through all servers that expose the service, in 24 hour time windows.
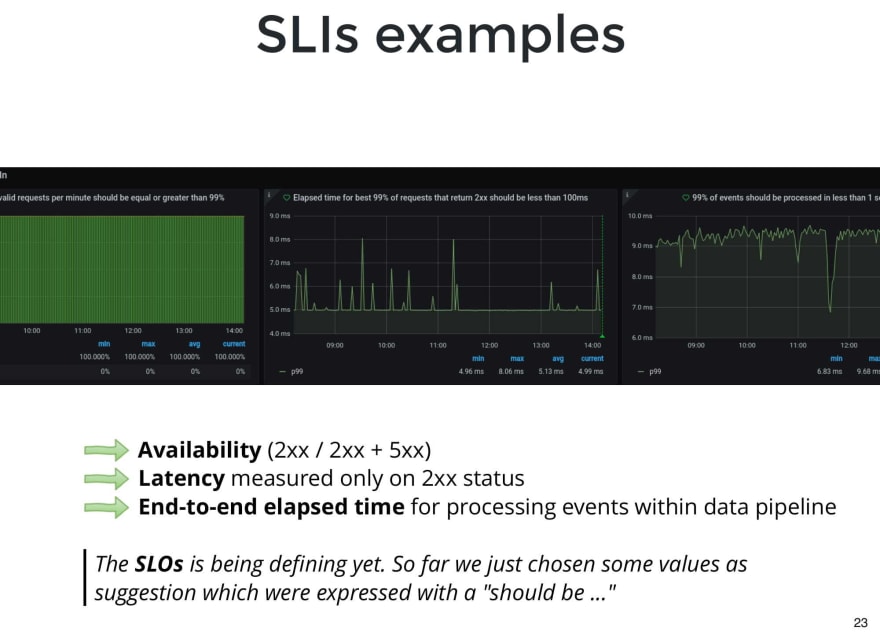
This is an example of one of our applications.
It exposes a service to receive events and process them asynchronously. In this service we choose 3 SLIs: availability, latency and the elapsed time since the event arrives, until it finishes processing.
We have not yet defined SLOs, because we are waiting to have more history about how the users use the service, but what we did is to choose some values as a suggestion, and leave them in the title and description of each panel.

A very important topic in our monitoring system is the alerts. When misused, they can generate more problems than if we didn't have them.

Alerts have to be fired only when something urgent happens, something that cannot be postponed. They have to be based on symptoms, that is, they have to notify us only if we are generating, or are on the way to generating, any negative impact on the user.
When this doesn't happen, when alarms notify us of something that can wait the next day, or of something that is not even a problem, then other problems come:
- Get used to having false positives and not see an important alarm on time.
- Waste time. As the SRE book says,paging a human is a quite expensive use of an employee’s time. If an employee is at work, a page interrupts their workflow and if the employee is at home, a page interrupts their personal time.
- Demoralize, demotivate, generate bad predisposition to monitor.
We leave some questions that we mainly take from Google's SRE book, which we think can serve as a guide to configure the alarms:
- The alarm that I am creating, will it detect a condition that makes me react urgently? will it have any actionable? Will it be immediately impacting users?
- When it happens, will I be able to take any action? Is it really urgent or can you wait the next day? For example, if in the cluster of a service some instances are down, but the traffic can continue to be served with the active instances, it is not necessary to launch an alert until the minimum number of active instances has been reached. In any case, notify it through another channel, so that the next day you can see it.
- Could the action be automated? As long as an action can be automated, that is preferable. It saves time, it is less error prone, and it doesn't depend on the knowledge of a particular person.
- The alert, will it bother other people unnecessarily?
What do we do with non-urgent alerts? For example, a node in a cluster is down. Another communication channel can be used for this type of notification. One that is checked during business hours, and that is part of the maintenance tasks, not the guard.
Ok, but so far we have not talked about logs, or traces, or anything about all those tools that are so widely used to monitor these days. Rather, we said that monitoring shouldn't contain many metrics, just the ones needed to answer What's Broken and Why.
Well, now let's see that for all the rest, there are the observability tools. And we are going to briefly review the most important ones, as they complement our monitoring system to help in troubleshooting and debugging.
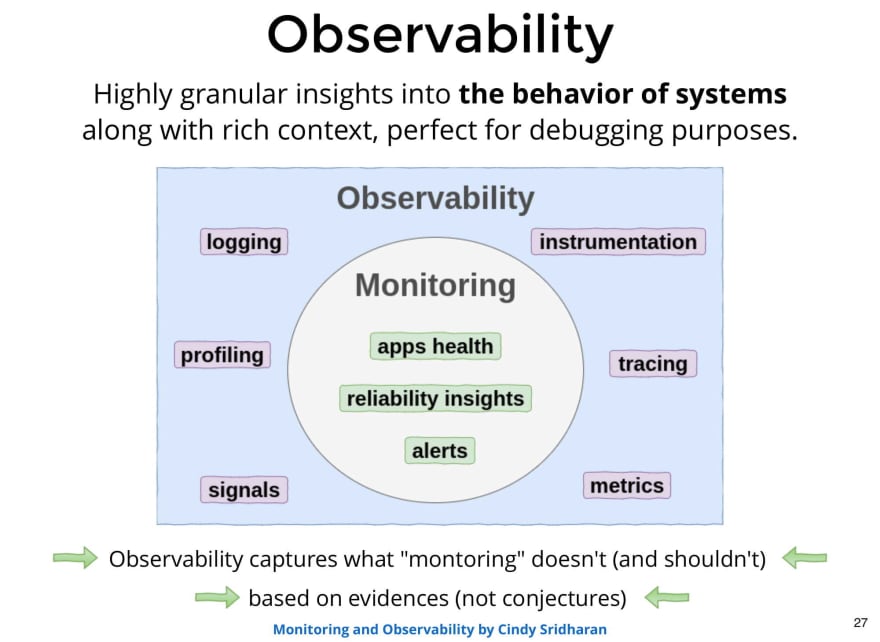
The goals of Observability are different from that of monitoring. Observability aims to allow us to know, in the highest possible level of detail, the behavior and internal state of our system, with rich context.
As you can see in the image, observability includes monitoring tools and goes further. It's said to cover everything that monitoring doesn't reach to cover.
Another important point is that it must be based on evidence, not conjectures or opinions.
Observability is a term that has generated a lot of debate in recent years, and it's been used many times for commercial purposes. Its origin comes from Control Theory, and what we can safely say is that its goal is to give a good understanding of the internal behavior of the system with a rich context.
Next, we will briefly review the most widely used observability tools in a distributed systems context.

When we try to solve a problem, probably at some point we want to go to check the log.
Logs are discrete events generated by applications as they execute their own logic. The log that is generated to make observability, in general, has data and details associated with the decisions and paths that the application was taking, so that it later serves to make a diagnosis or show what the application did. Something important is that the log always give us evidence about what the application did in the past.
Some suggestions to keep in mind when adding logs:
- Generate logs with context. Either an identifier per request, or something that allows us to correlate logs conveniently.
- Standardize the logs, in order to have the same type of information at each log level.
- Whenever possible, use structured logs so that it is not limited to being read by a human, but can also be processed programmatically. Then you can easily group, aggregate, generate metrics on the fly, index by specific fields, etc.
Regarding structured logs, we left an image presented in a talk at GRAFANACON of this year. You can see how, through some lines of logs, it can easily generate a metric about the number of requests by endpoint and status code, which can be very useful in the middle of an incident in production. In this case, they are doing it with a query on Loki, using LogQL, a query language similar to PromQL from Prometheus.
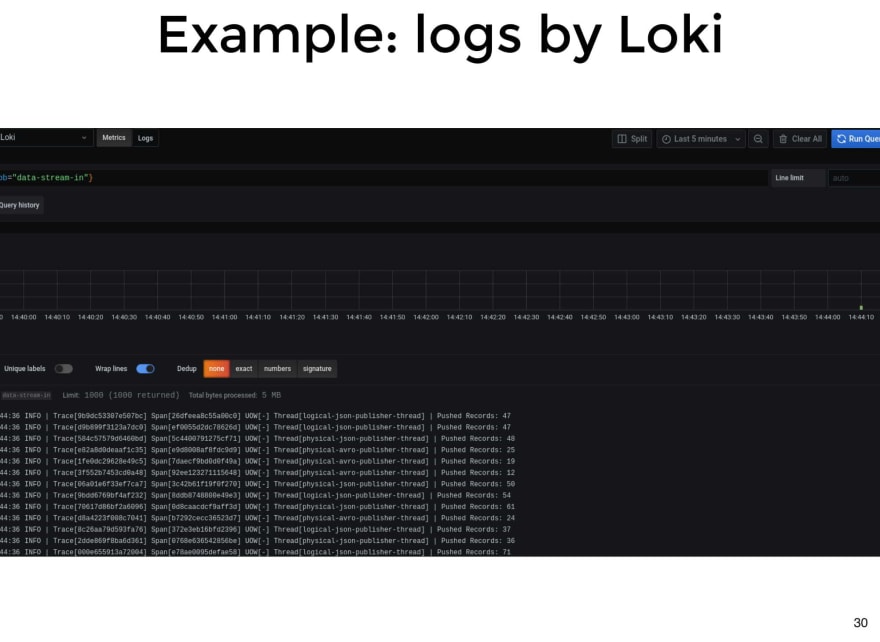
Here is an example of how we list the logs of an application, in this case the app is called data-stream-in and we are using Loki.

Here is another example, filtering only the warnings.

And here is another example, generating a metric of the number of logs per minute, grouped by level. In this case we see that we have logs in INFO and in WARN level.

Unlike the log, metrics are aggregated values, such as counters, histograms, gauge (values that can increase or decrease). Metrics are used both to know the current state of a system and for its trend. This means that they are useful for predicting where the system is going. For example, with a metric of the usage of disk space, we can see if we have little free space and if it’s actually tending to run out of disk, or conversely, to be gaining disk space.
In addition to the metrics of the system itself, such as latency, throughput, errors, and saturation, it is important to consider other aspects underlying the system. Aspects like the hiccups on the VMs, the usage of CPU and the number of pauses introduced by the GC, are some of those that must also be observed to better understand the performance of our system.

Here is an example of system metrics we take on our VMs.

Tracing is another very useful tool that allows you not only to analyze and answer questions about a particular application, but also to answer questions related to the interaction of a set of applications along a flow that runs by a single request.
A trace is a set of individual events (called span) that are produced by a parent event. Often the root span is a request. The interesting thing is that it easily shows the causality of events that are related to a particular trace and it can be visualized in a single image. Some interesting questions that can be answered are:
- What is the path taken by a request?
- Where is the bottleneck, which slows down all execution?
- How much time does it produce by the network lag?
- What happens in each service, for a particular request?
This slide is taken from a talk about distributed tracing that we gave a few years ago, we left the link to the presentation.

This is an example of distributed tracing between two applications. You can easily visualize the space in time that each application took place, and a series of interesting details in each span, such as headers, times, status code, etc.

In summary:
- Use The Four Golden Signal and USE Method to monitor our services.
- Instrument your services as soon as possible.
- Combine profiling, logs and traces, as auxiliary tools for troubleshooting.
- Iterate. This is an iterative process. Start with a few metrics and a few questions, as we said, keeping it simple, and iteratively evolve your monitoring system.
After developing all these topics, some open questions, and others not so open, that we can think are:

Some of the previous questions take us to a line of thought where controllability is the ultimate end of observability, and in a system that controls itself from its dynamism and where it is not alone in the universe but communicates by sending and receiving signals that influence each other, and that over time help infer the state of others and that of oneself.
If we follow this idea of controllability we fall into Theory of Control that 2000 years ago was used by the Egyptians in a water clock (Clepsydra), or later, in the Second World War where some weapons were developed based on this idea, such as anti-aircraft guns.

It’s intensively used in:
- Process control.
- Electronics.
- Aerospace Industry.
- Manufacturing automation.

The basic principle is to continuously compare the current output of the system with the reference value, and apply changes to the input of the system to counteract any deviation that exists between the output and the reference value.
If we think in code, inside a while (true) we have the current and the desired state, and we try at all times to reach the desired value by applying corrections with the feedback loop.
while (true) {
    currentState = getCurrentState()
    desiredState = getDesiredState()
    makeConform(currentState, desiredState)
}
Some known examples where it's already used are:
- Control speed of a car.
- CPU cooler where the metric it tracks is the temperature and what it adjusts is the voltage applied to the cooler.
-
Kubernetesand autoscaling use aPID(Proportional, Integral, Derivative) Loop with some checks and some other gadgets. -
Control planefrom Amazon.

Thank you!!

Top comments (0)