
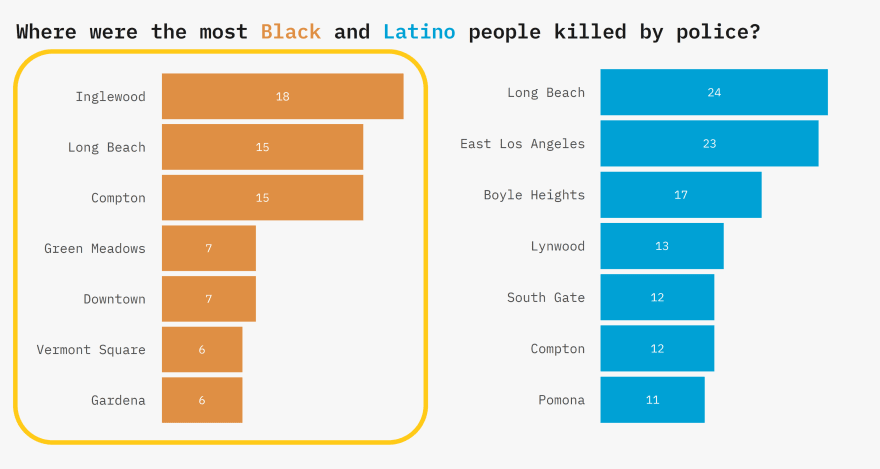
This is my second post about exploring the Los Angeles Times' database of police killings in L.A. County. My first one was about mapping where each Black person who was killed by police in L.A. County died. In my main blog post I wanted to learn more about the Black and Latino communities that have been disproportionately affected by police violence and made a simple graphic about it.
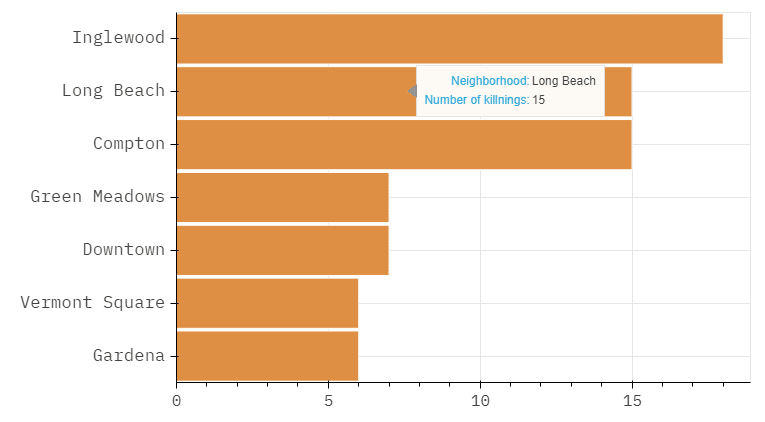
To try out a simple chart for my first experience with Bokeh, I decided to recreate this horizontal bar chart I made for the graphic of my main post:
Interactive version
Live plot
Creating this required one step before making the plot itself. Since this is a horizontal bar chart, we need to make a list of factors to pass into the categorical x-axis with the argument y_range in figure(). This DataFrame is my source for the plot:
top_neighborhoods = killings_data[killings_data.race == 'black'].neighborhood.value_counts().head(7).to_frame().sort_values(by='neighborhood', ascending=True)

To make the list of categorical factors we use ColumnDataSource() from bokeh.models and tolist():
from bokeh.models import ColumnDataSource
source = ColumnDataSource(data=top_neighborhoods)
neighborhoods = source.data['index'].tolist()
Now we can make the plot. Here are the necessary imports and comments describing them:
from bokeh.plotting import figure, show, output_file # output_file = output as HTML
from bokeh.models.tools import HoverTool # for hover tooltip
from bokeh.models import Axis            # for axis settings
from bokeh.io import output_notebook     # optional: to output in notebook
Create the figure with figure() and set the plot dimensions, the y categorical values using the created list, and optionally remove the toolbar:
output_notebook() # optional: show the output in the notebook
p = figure(plot_width=750, plot_height=400,
            y_range = neighborhoods, # use the list as the range of y values
            toolbar_location=None)   # remove the toolbar since it isn't needed for this plot
Create the plot by defining the following:
source - the source object we made with ColumnDataSource()
y - the categorical y variable
right - the numeric x variable
height - height of the bars, a value between 0 and 1
line_color - color of the outline of the bars
color - color of the bars
# create the horizontal bar chart
p.hbar(y='index', right='neighborhood', source=source, height=0.95, line_color='white', color ="#DF8F44")
The following are the optional hover and style settings for this plot with their purposes commented:
p.x_range.start = 0  # start value of the x-axis
hover = HoverTool()  # initiate hover tool
hover.tooltips = [("Neighborhood","@index"),   ## define the content of the hover tooltip
                   ("Number of killnings","@neighborhood")]
hover.mode = 'hline' # set the mode of the hover tool
p.add_tools(hover)   # add the hover tooltip to the plot
# style the plot
p.xaxis.major_label_text_font = 'IBM Plex Mono'
p.xaxis.major_label_text_font_size = '12pt'
p.yaxis.major_label_text_font = 'IBM Plex Mono'
p.yaxis.major_label_text_font_size = '13pt'
# output the HTML file
output_file("neighborhoods.html", title='Neighborhoods with the most Black police killings')
show(p) # show in notebook
The output neighborhoods.html that was created should pop up in your browser and be saved in your directory. This is the file we'll use to embed the plot.
Embed the plot
I believe there are different ways you can embed Bokeh plots to websites, but the approach I took since I found it the simplest was to host the created neighborhoods.html on my site (you can visit it here), then use that as the source of the <iframe> to embed the plot.
Steps:
- Host the HTML file somewhere like GitHub pages (free) or your another site of yours.
- Copy its path and plug it into the
srcof an<iframe>tag:
<iframe src="/today-i-learned-posts/bokeh-plots-embed/neighborhoods.html"
    sandbox="allow-same-origin allow-scripts"
    width="100%"
    height="500"
    scrolling="no"
    seamless="seamless"
    frameborder="0">
</iframe>
Now you can use the <iframe> to embed your interactive Bokeh visualization on any website!
I hope you found this helpful. If you have any questions, feel free to comment below or tweet/DM me.

Top comments (0)