with Ana Margarita Medina
If you follow Adriana's writings on Observability, you may recall a post from back in June introducing the concept of Observability-Landscape-as-Code (OLaC).
An Observability Landscape is made up of the following pieces:
- Application instrumentation
- Collecting and storing application telemetry
- An Observability back-end
- A set of meaningful SLOs
- Alerts for on-call Engineers
Keeping that in mind, OLaC is simply the codification of your Observability Landscape, thereby ensuring consistency, maintainability, and reproducibility.
That’s all well and good, but how about seeing this thing in action? Well, my friend, you’ve come to the right place, because today, you get to see a tutorial featuring a number of OLaC practices in action!
Today, Ana Margarita Medina (my fellow DevRel and partner in crime) and I will be highlighting the following aspects of OLaC:
-
How? À la OpenTelemetry, via the OpenTelemetry Demo App, which contains examples of Traces and Metrics instrumentation.
-
Collecting & storing application telemetry
How: OpenTelemetry Collector is deployed via code (Helm chart), alongside the various services that make up the OpenTelemetry Demo App.
-
Codifying your Observability back-end configuration
How: Using the Lightstep Terraform Provider to create dashboards in Lightstep.
We wanted to showcase OLaC principles with a real-life example using modern cloud-native tooling...Which means using Kubernetes for our cloud infrastructure with Google Cloud’s Kubernetes offering, GKE. Now, since we are good practitioners of OLaC and SRE, we won’t just be setting things up through the clickity click of a UI. No sirreee. Instead, we’ll be #automatingAllTheThings using HashiCorp Terraform. Terraform allows us to do infrastructure-as-code (IaC), and gives us tons of added benefits like better control over our resources and standardization. These are key principles in OLaC and IaC.
We will be deploying OpenTelemetry Demo App to our cluster. The Demo App has been instrumented using OpenTelemetry, and will send Traces and Metrics through the OpenTelemetry Collector to Lightstep.
Are you ready??? Let’s get started!
Tutorial
Pre-Requisites
Before you begin, you will need the following:
- A Lightstep account so you can see application Traces, and Metrics dashboards
- A Lightstep Access Token for the Lightstep project you would like to use
- A Lightstep API key for creating dashboards in Lightstep.
- Terraform CLI to run the Terraform scripts
- A Google Cloud account, so you can create a Kubernetes cluster (GKE)
- gcloud CLI to interact with Google Cloud
- kubectl to interact with Kubernetes
Steps
In today’s tutorial, we’ll be running Terraform code to showcase OLaC in action. For convenience, the main components have been broken up into separate Terraform modules that will do the following:
- Create a Kubernetes cluster (GKE) in Google Cloud using the Google Terraform Provider. This is defined in the k8s module in our repo.
- Deploy the OpenTelemetry Demo App to the cluster using the Helm Terraform Provider. This is defined otel_demo_app module in our repo.
- Create Metrics dashboards in Lightstep Terraform Provider. This is defined in the lightstep module in our repo.
The full code listing for this tutorial can be found here.
1- Clone the example repo
Let's start by cloning the example repo:
git clone https://github.com/lightstep/unified-observability-k8s-kubecon.git
2- Initialize Sub-Modules
This project makes use of a few Git submodules, so in order to ensure that things work nicely, you’ll need to pull them in:
cd unified-observability-k8s-kubecon
git submodule init && git submodule update
3- Google Cloud Login
Before we can create a GKE cluster you must authenticate your Google Cloud account:
gcloud auth application-default login --no-launch-browser
You will be presented with a link which you need to open up in a browser, to authenticate your Google ID. Once you are authenticated, the browser will display an authorization token for you to paste in the command line, as follows:
4- Create terraform.tfvars
Now that you’re authenticated, let’s get ready to Terraform! Before you can do that, we need to create a terraform.tfvars file.
Lucky for you, we have a handy-dandy template that you can use to get started:
cd k8s-cluster-with-otel-demo/terraform
cp terraform.tfvars.template terraform.tfvars
Next populate the following values in the file:
-
<your_gcp_project>: The name of your Google Cloud project. Don’t know your project name? No problem! Just rungcloud config get-value projectto find out what it is! -
<your_gke_cluster_name>: The name you wish to give your GKE cluster. Make sure it follows Kubernetes cluster naming conventions (i.e. no underscores_or special characters). -
<your_lightstep_access_token>: Your Lightstep Access Token. This is used to send Traces to your Lightstep Project. -
<your_lightstep_api_key>: Your Lightstep API key. This is used to create our Metrics dashboards. -
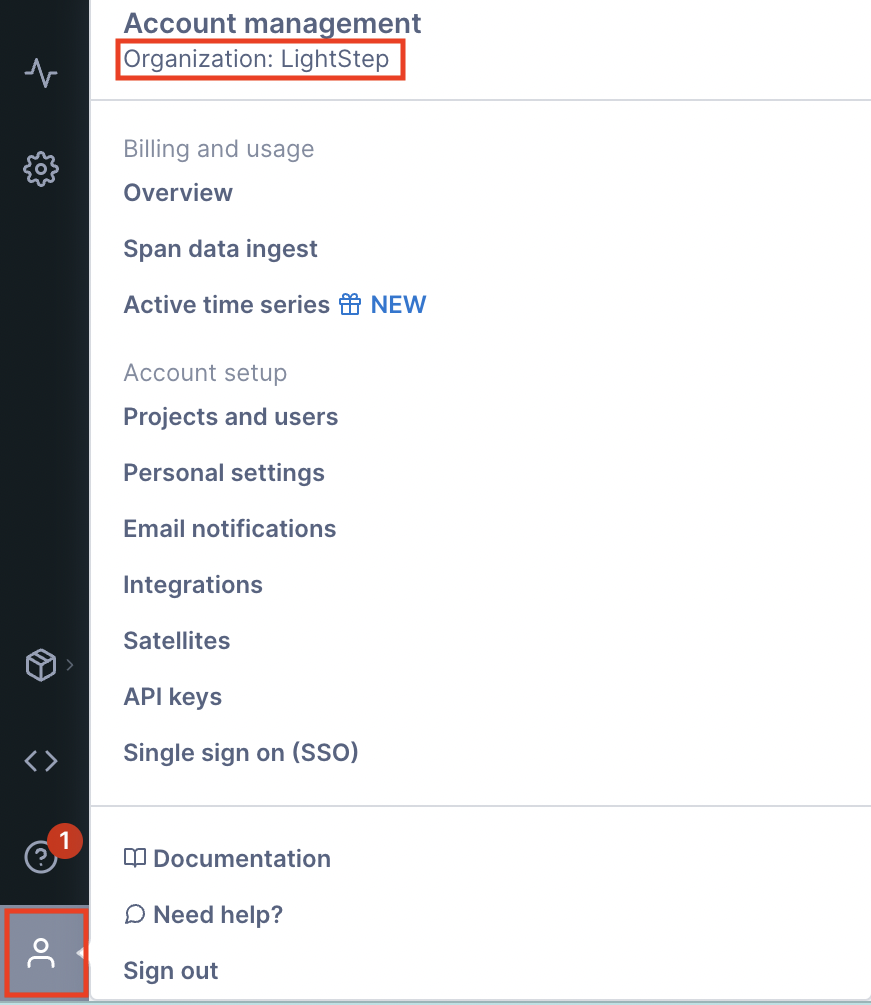
<your_lightstep_org_name>: Your Lightstep organization name. Not sure what your organization is called? No problem! Log into Lightstep,and click on the person icon on the bottom left of your screen. This will pop up a little menu. The organization name can be found under the “Account Management” heading, like this:
Notice that my organization is called “LightStep”. Yours will be different. Note also that Organization names are case-sensitive.
-
<your_lightsep_project_name>: The name of the Lightstep Project where the Metrics dashboards will be displayed.
Note:
terraform.tfvarsis in.gitignoreand won't be put into version control.
5- Run Terraform
This step will initialize Terraform (install providers locally), and then will apply the Terraform plan.
It will:
- Create a Kubernetes cluster
- Deploy the OpenTelemetry Demo App using the OpenTelemetry Demo Helm Chart
- Create dashboards in Lightstep
Before running the commands below, make sure that you’re already in the k8s-cluster-with-otel-demo/terraform folder.
terraform init
terraform apply -auto-approve
Please note that this step may take up to 30 minutes, depending on GKE’s disposition. Be patient. 😄
6- Update your kubeconfig
Now that the cluster is created, you can add it to your kubeconfig file! By default, the file is saved at $HOME/.kube/config.
Before you can update your kubeconfig, you first need to make sure that you have the gke-gcloud-auth-plugin installed:
gcloud components install gke-gcloud-auth-plugin
gke-gcloud-auth-plugin --version
echo "export USE_GKE_GCLOUD_AUTH_PLUGIN=True" >> ~/.bashrc
Now we can add the cluster to kubeconfig:
gcloud container clusters get-credentials $(terraform output -raw kubernetes_cluster_name) --region $(terraform output -raw region)
This gets the kubernetes_cluster_name and region output values from Terraform (that’s the terraform output -raw stuff), and plunks those into your gcloud container clusters get-credentials command.
Or, if you closed the terminal in which you were running Terraform and lost your output values, you can also do this:
gcloud container clusters get-credentials <cluster_name> --region <region>
Where <cluster_name> and <region> correspond to the values you entered in Step 3 in your terraform.tfvars file.
7- Check out the OTel Demo app
Now that you’ve got the OpenTelemetry Demo App deployed to your cluster, let’s take a look at it! First, let’s peek into Kubernetes to see what’s up.
If you run kubectl get ns, you’ll notice that there’s now a new namespace called otel-demo:
This is where we deployed the OTel Demo app. Let’s look into this namespace to see what we’ve created. First, let’s look at the pods with kubectl get pods -ns otel-demo:
Notice how we deployed a bunch of different services that make up the OTel Demo App, including adservice, cartservice, recommendationservice, etc.
We also deployed an OTel Collector. Its configuration YAML is stored in a configmap. We can take a peek by running kubectl describe configmap otel-demo-app-otelcol -n otel-demo:
You can see that we also reference a variable called ${LS_TOKEN} which represents your Lightstep Access Token, which you set in terraform.tfvars. But where is it? The secret is mounted to the OTel Collector container instance as a secret called otel-collector-secret. Let’s take a look at the secret by running kubectl describe secret otel-collector-secret -n otel-demo:
All this magic happens in otel-demo-app-values-ls.yaml. This is a version of values.yaml from the OTel Demo App Helm Chart with updates to the Collector configs so that we can configure the OTel Collector to send Traces to Lightstep.
8 - Run the OTel Demo App
Okay...enough Kubernetes talk. Let’s look at the OpenTelemetry Demo App! You can access the Demo App by Kubernetes port-forward:
kubectl port-forward -n otel-demo svc/otel-demo-app-frontend 8080:8080
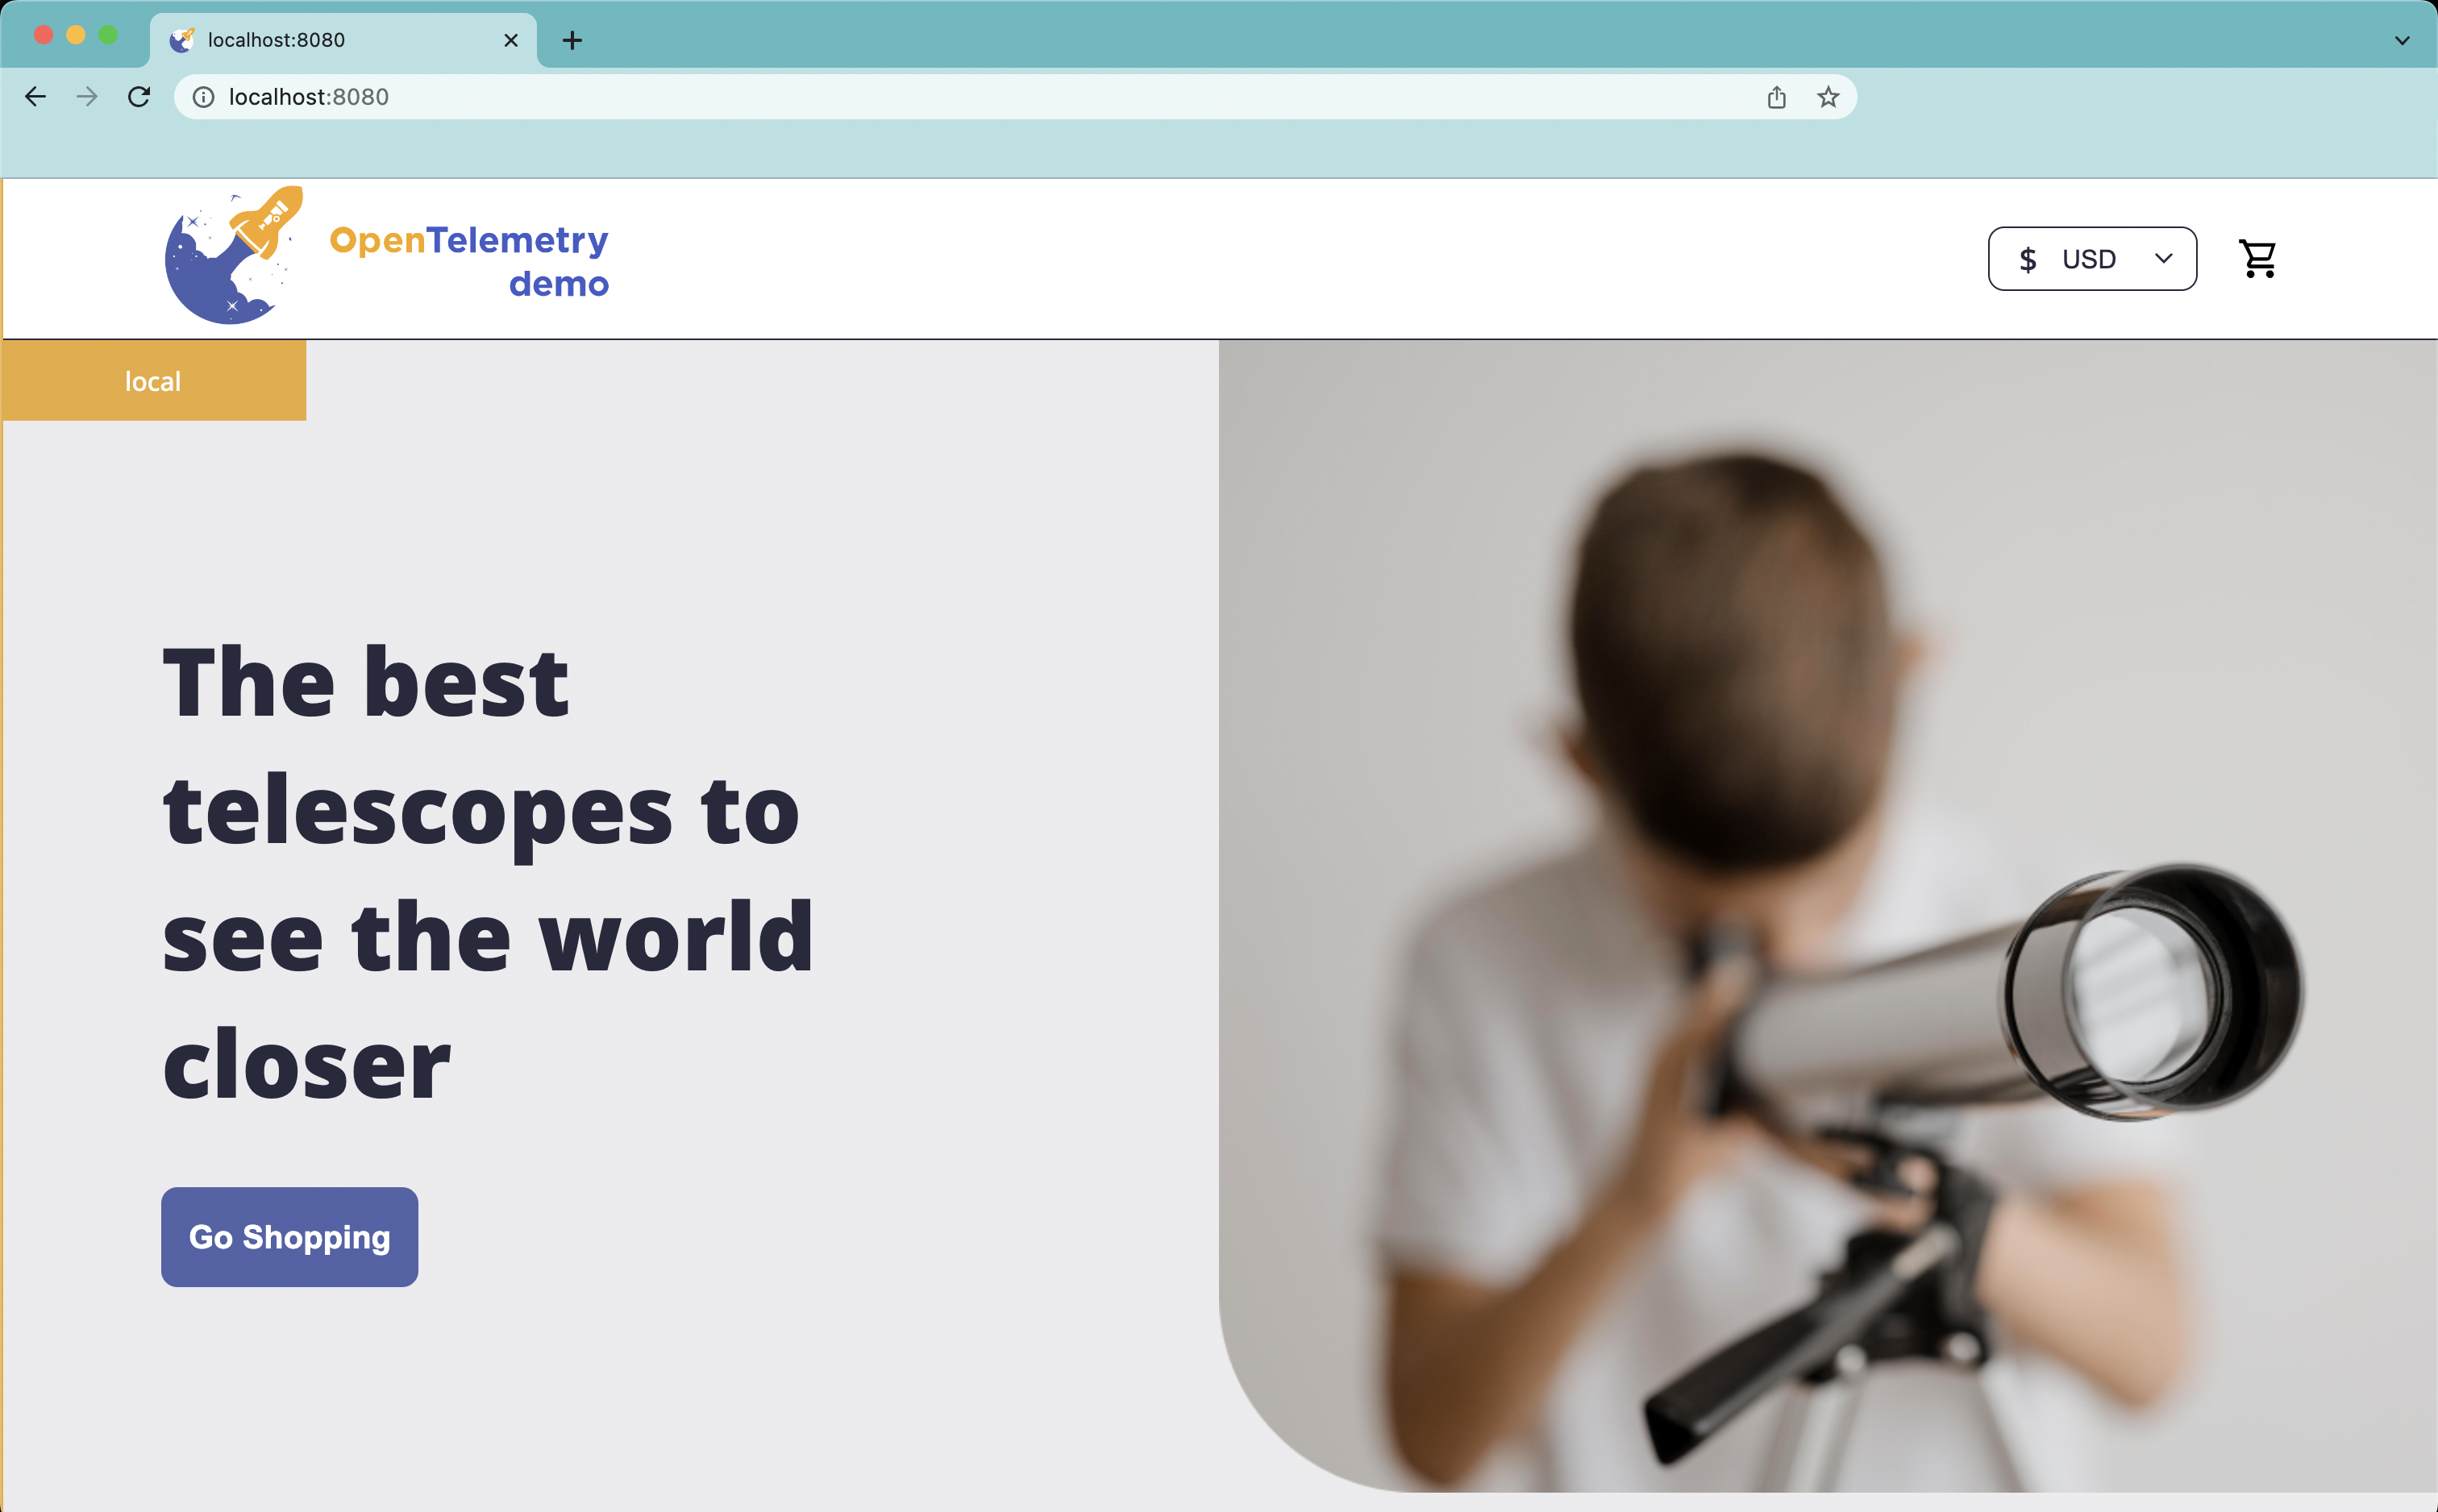
To access the front-end, go to http://localhost:8080:
Go ahead and explore the amazing selection of telescopes and accessories, and buy a few. 😉🔭
9- See Traces in Lightstep
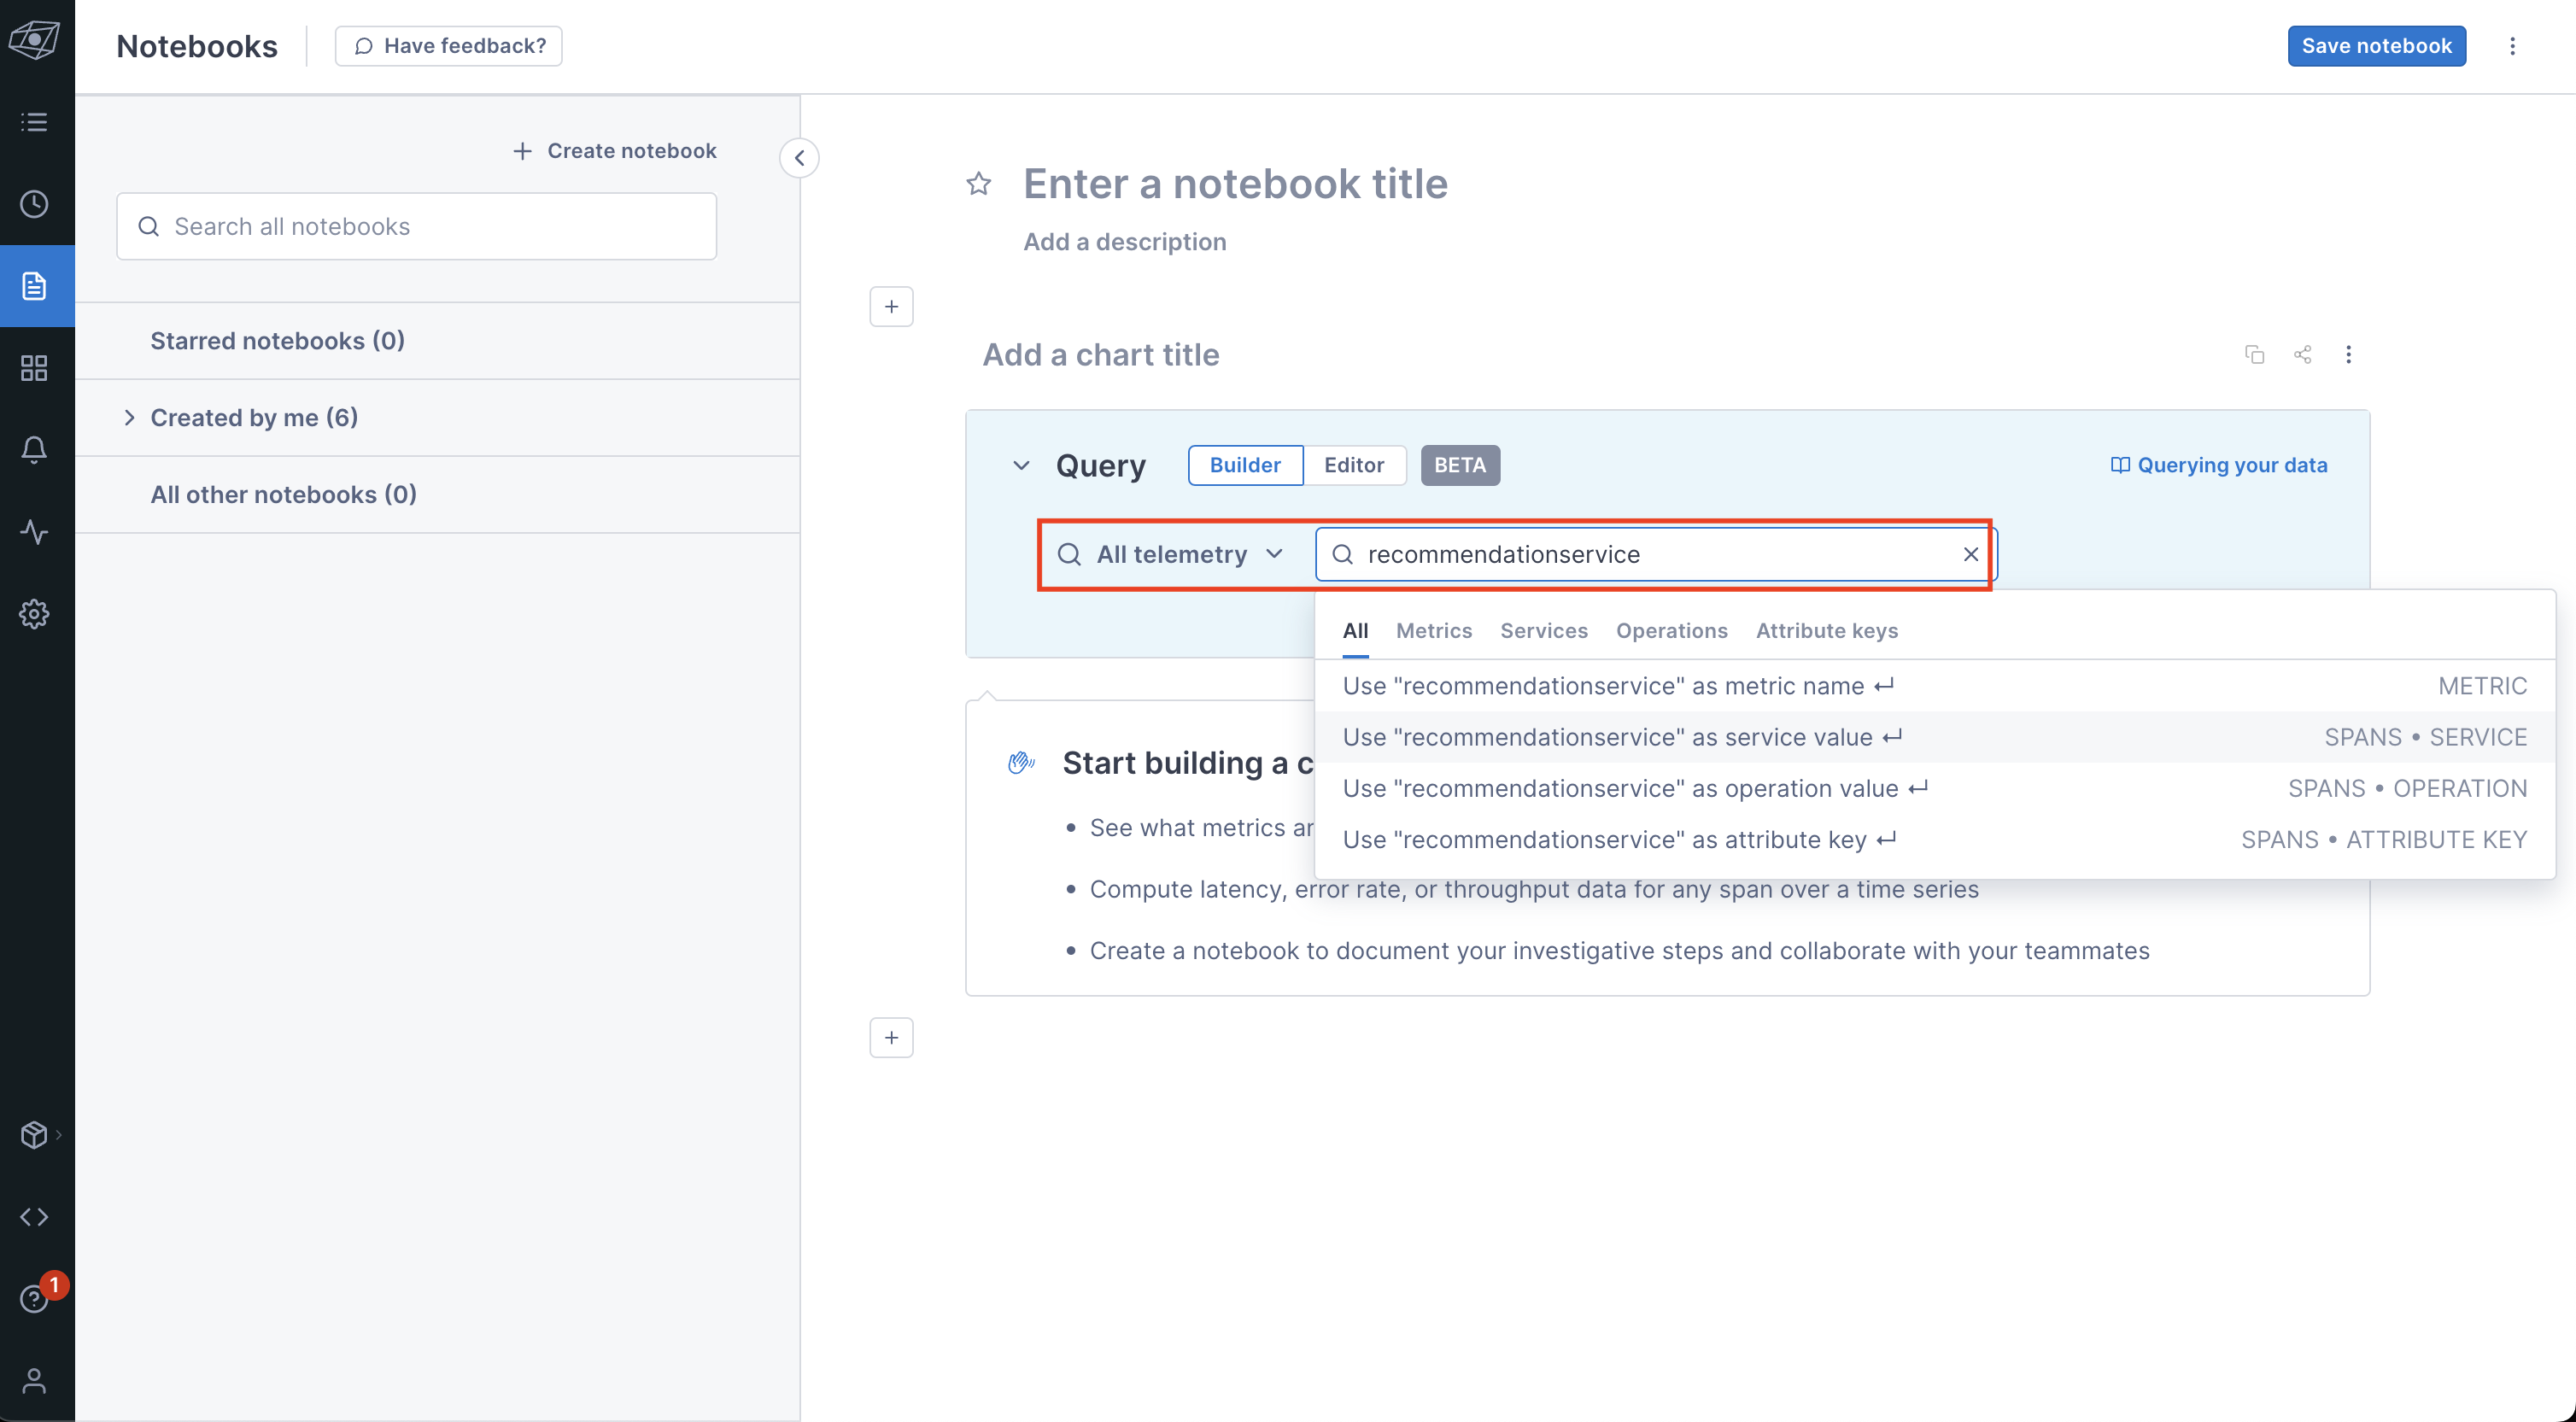
We can now pop over to Lightstep and check out some Traces. Let’s do this by creating a Notebook.
First, click on the little page icon on the left nav bar (highlighted in blue, below). That will bring up this page:
Next, we build our query for our Traces. Let’s look at the traces from the recommendationservice. We’ll do by entering recommendationservice in the field next to “All telemetry”. Because this is a service, select the second value from the drop-down, which says, “Use ‘recommendationservice’ as service value”, as per below:
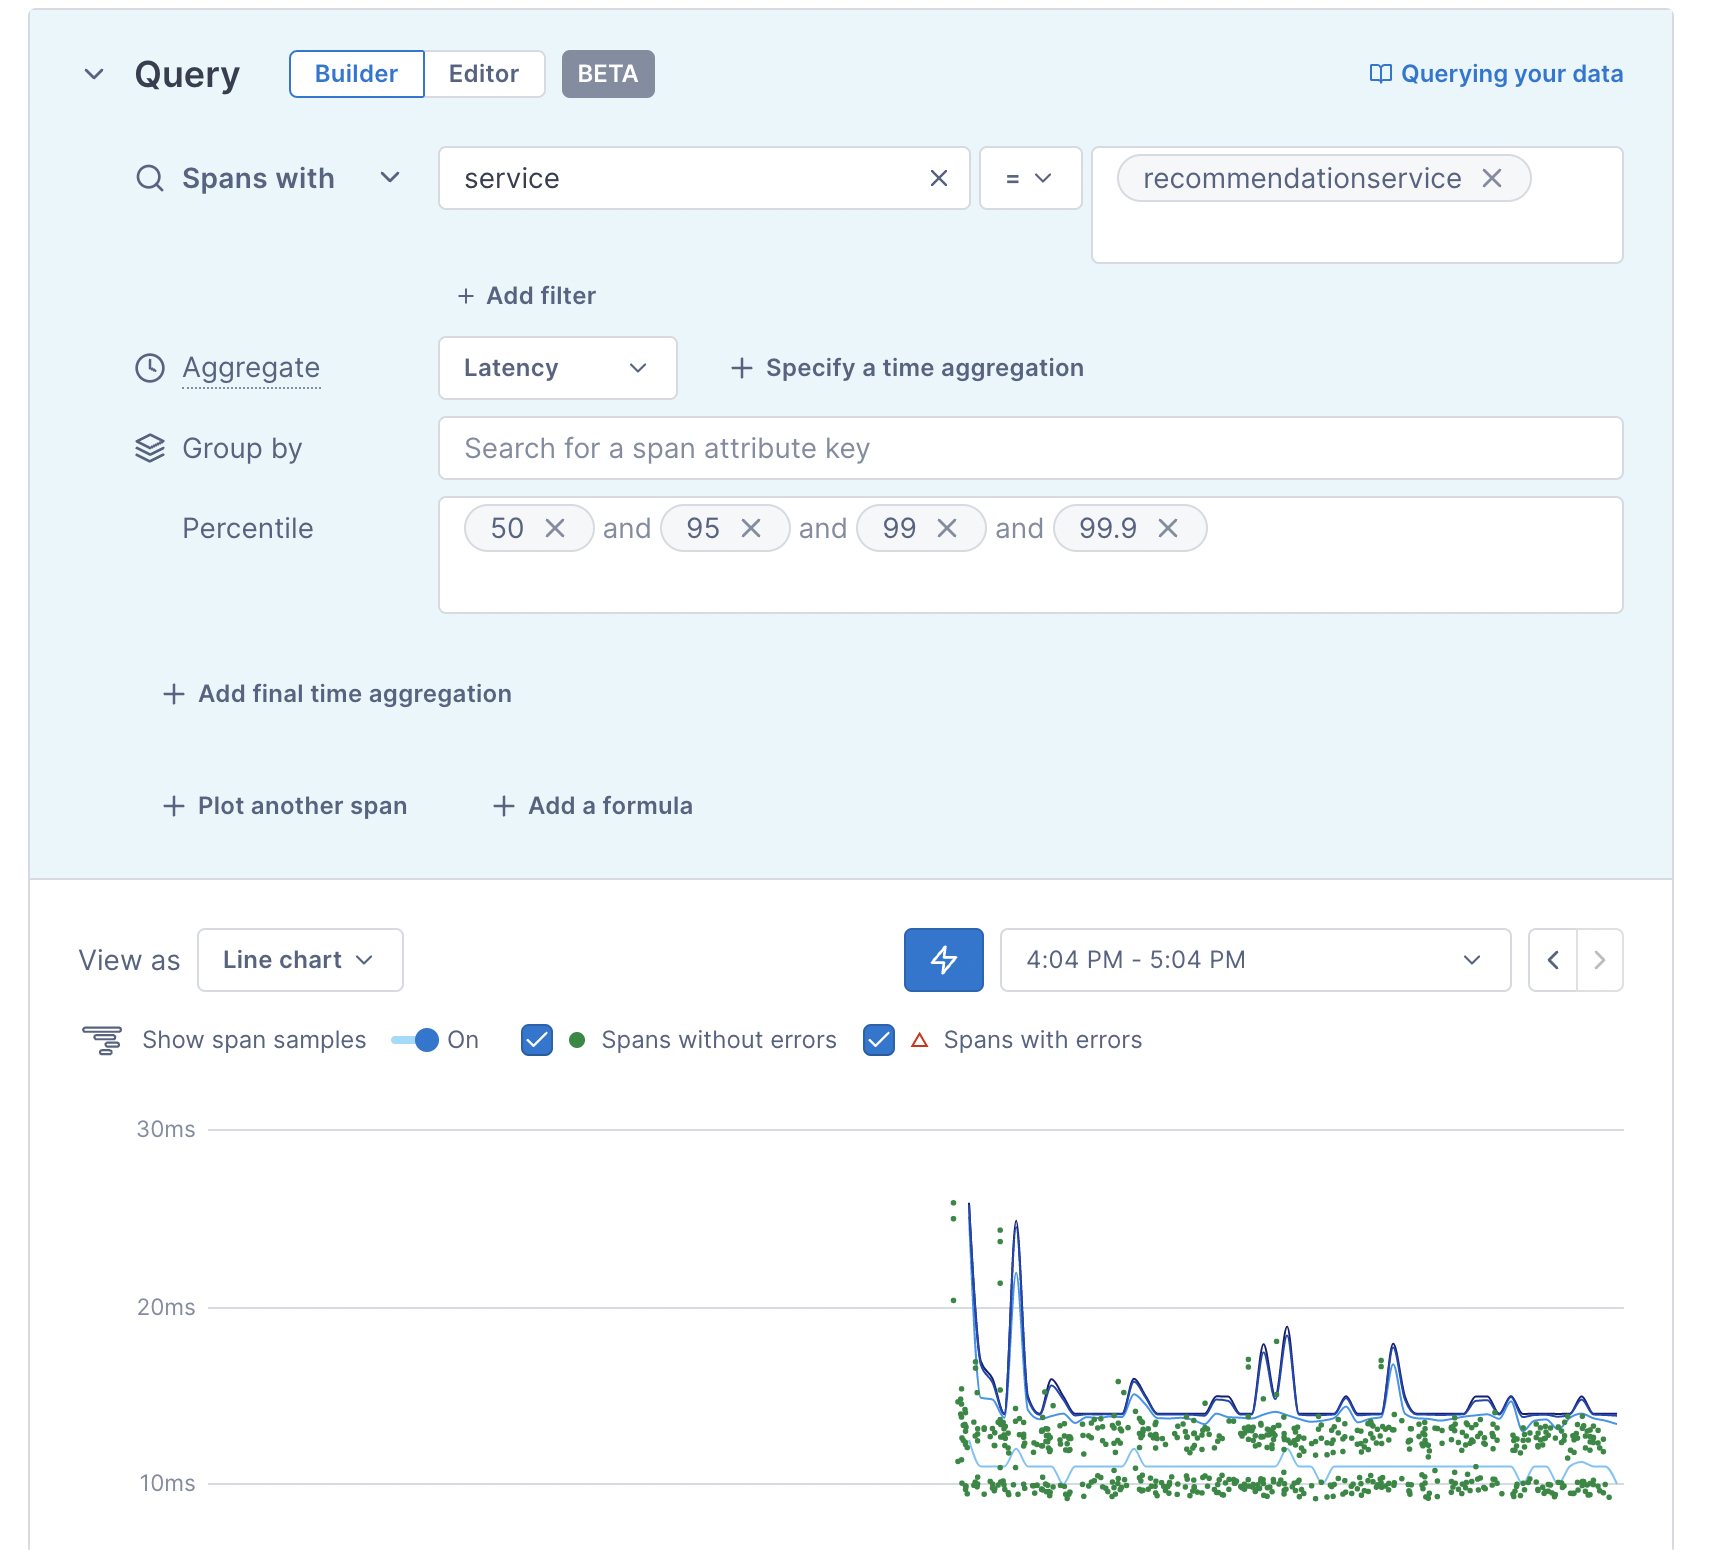
After you select that value, you’ll see a chart like this:
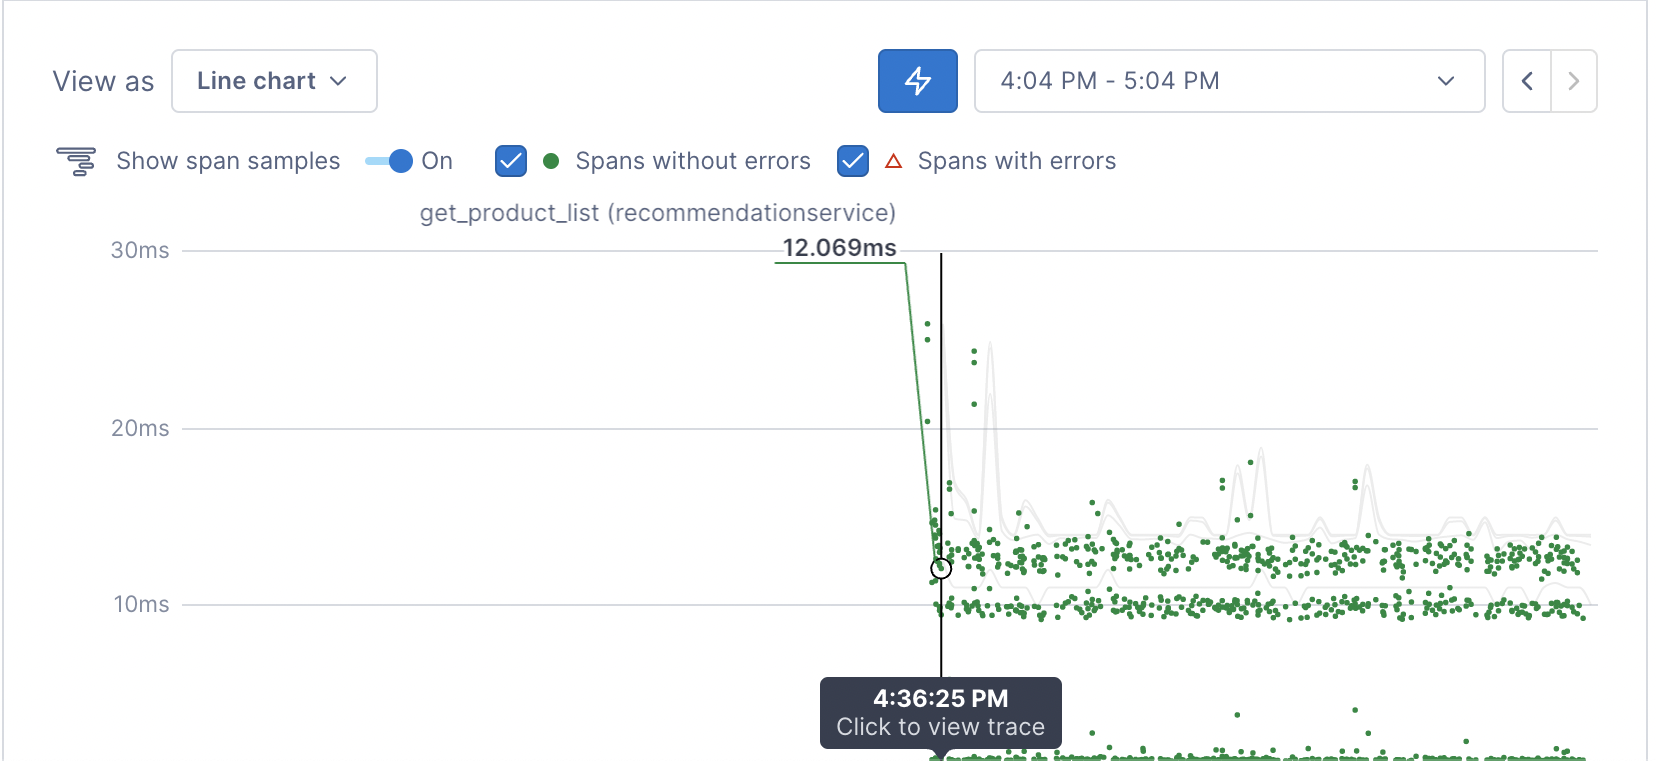
The little green dots represent trace exemplars from that Service. Hover over one of them to see for yourself!
If you click on one of these dots, you’ll get taken to the Trace view. Before you click, be sure to save your Notebook first (don’t worry, you’ll get a reminder before you navigate away from the page)!
Here’s the Trace view we see when we click on the get_product_list dot (Operation) above::
Pretty cool, amirite?
10- See Kubernetes Metrics in Lightstep
But wait...there’s more! Not only can we see Traces in Lightstep, we can also see Metrics!
Remember when you ran terraform apply? Well, not only did it create a Kubernetes cluster, deploy the OTel Demo App (and OTel Collector), it also created some handy-dandy Metrics dashboards for us.
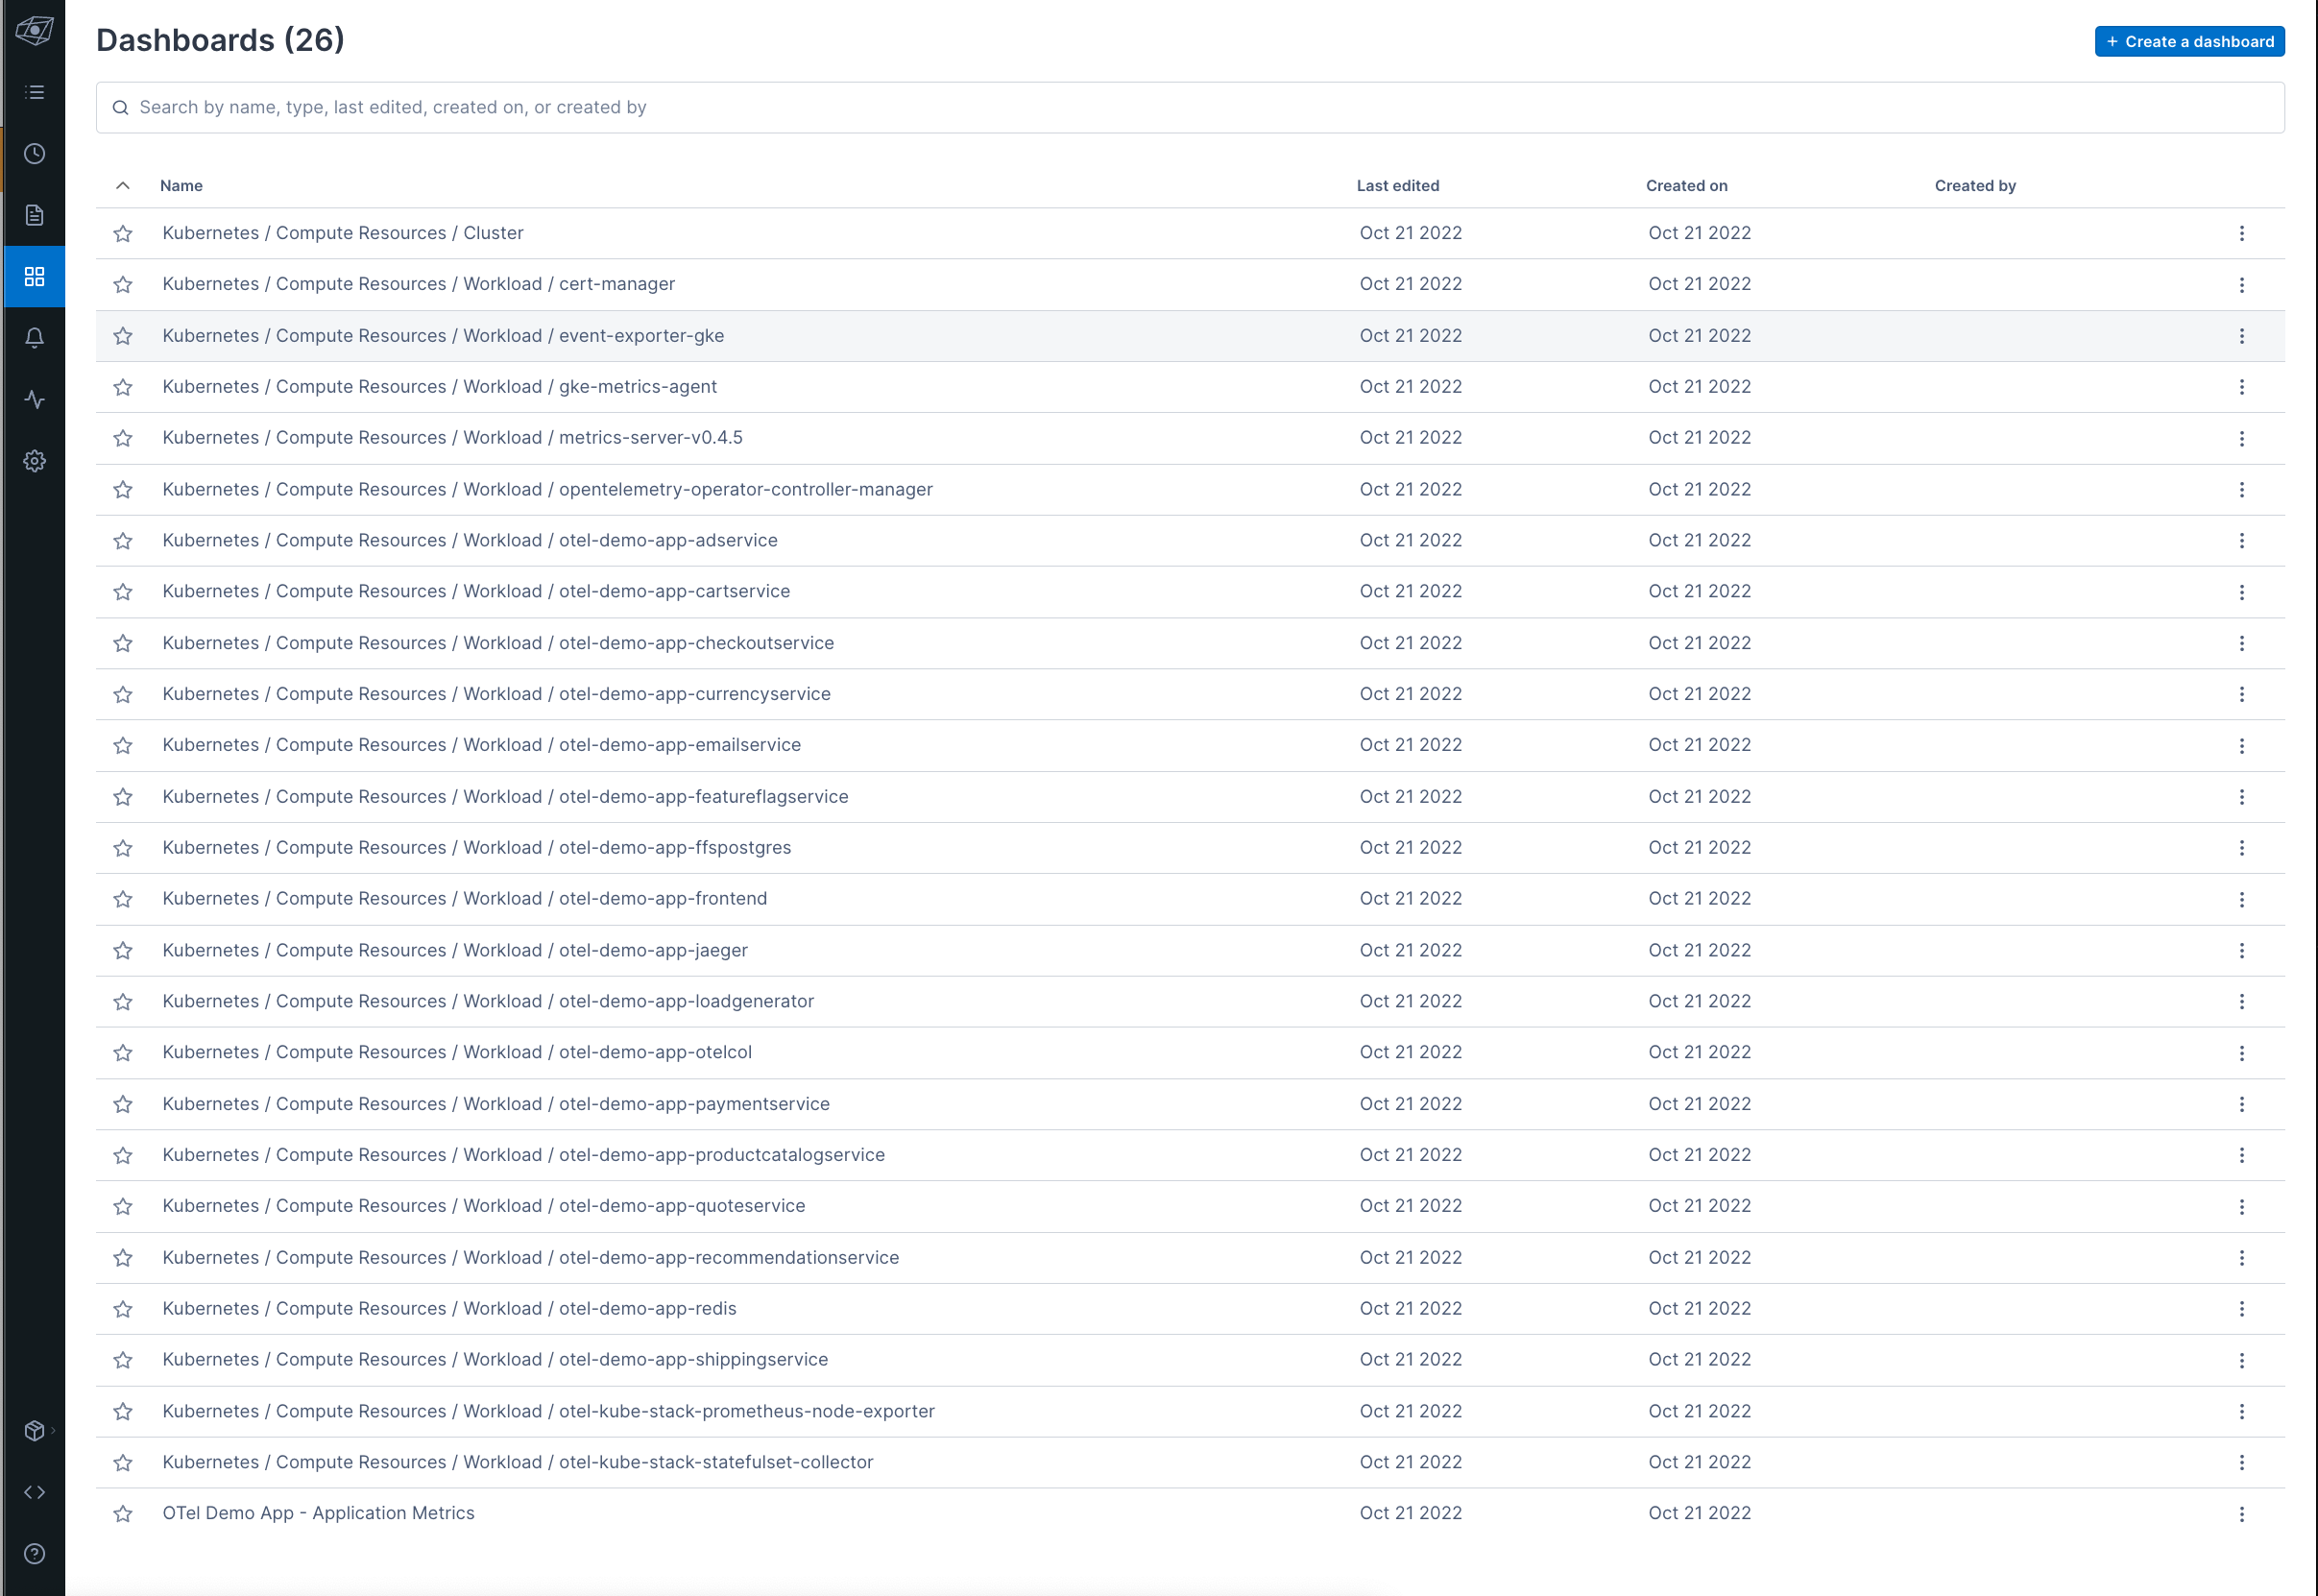
You can check out the newly-created Metrics dashboards by going to the Dashboards icon (the icon with 4 little squares) on the left navigation bar:
First, let’s check out the Kubernetes / Compute Resources / Cluster dashboard. This dashboard lets you see the state of your cluster.
We then have various other Metrics called Kubernetes Workload Metrics. These are the dashboards with names that start with “Kubernetes / Compute Resources / Workload”. These dashboards are specific to the services you are running. They take into account the Kubernetes Workloads in your various namespaces, using kube-state-metrics. For a closer look, check out otel_demo_app_k8s_dashboard.tf.
We used Lightstep’s Prometheus Kubernetes OpenTelemetry Collector to get these Metrics into Lightstep. This Helm chart is inspired by kube-prometheus-stack, but with one crucial difference -- no Prometheus! We’re able to use recent enhancements to the OpenTelemetry Operator for Kubernetes such as support for Service Monitors in order to scrape Prometheus metrics from pods, system components, and more.
The best part is that you don’t need to install and maintain a Prometheus instance to be able to run it! But wait…there’s more! You also don’t need to use Lightstep as your Observability back-end in order to take advantage of this special Collector! How cool is that??
Note: You can learn more about the Prometheus Kubernetes OpenTelemetry Collector by checking out the docs here.
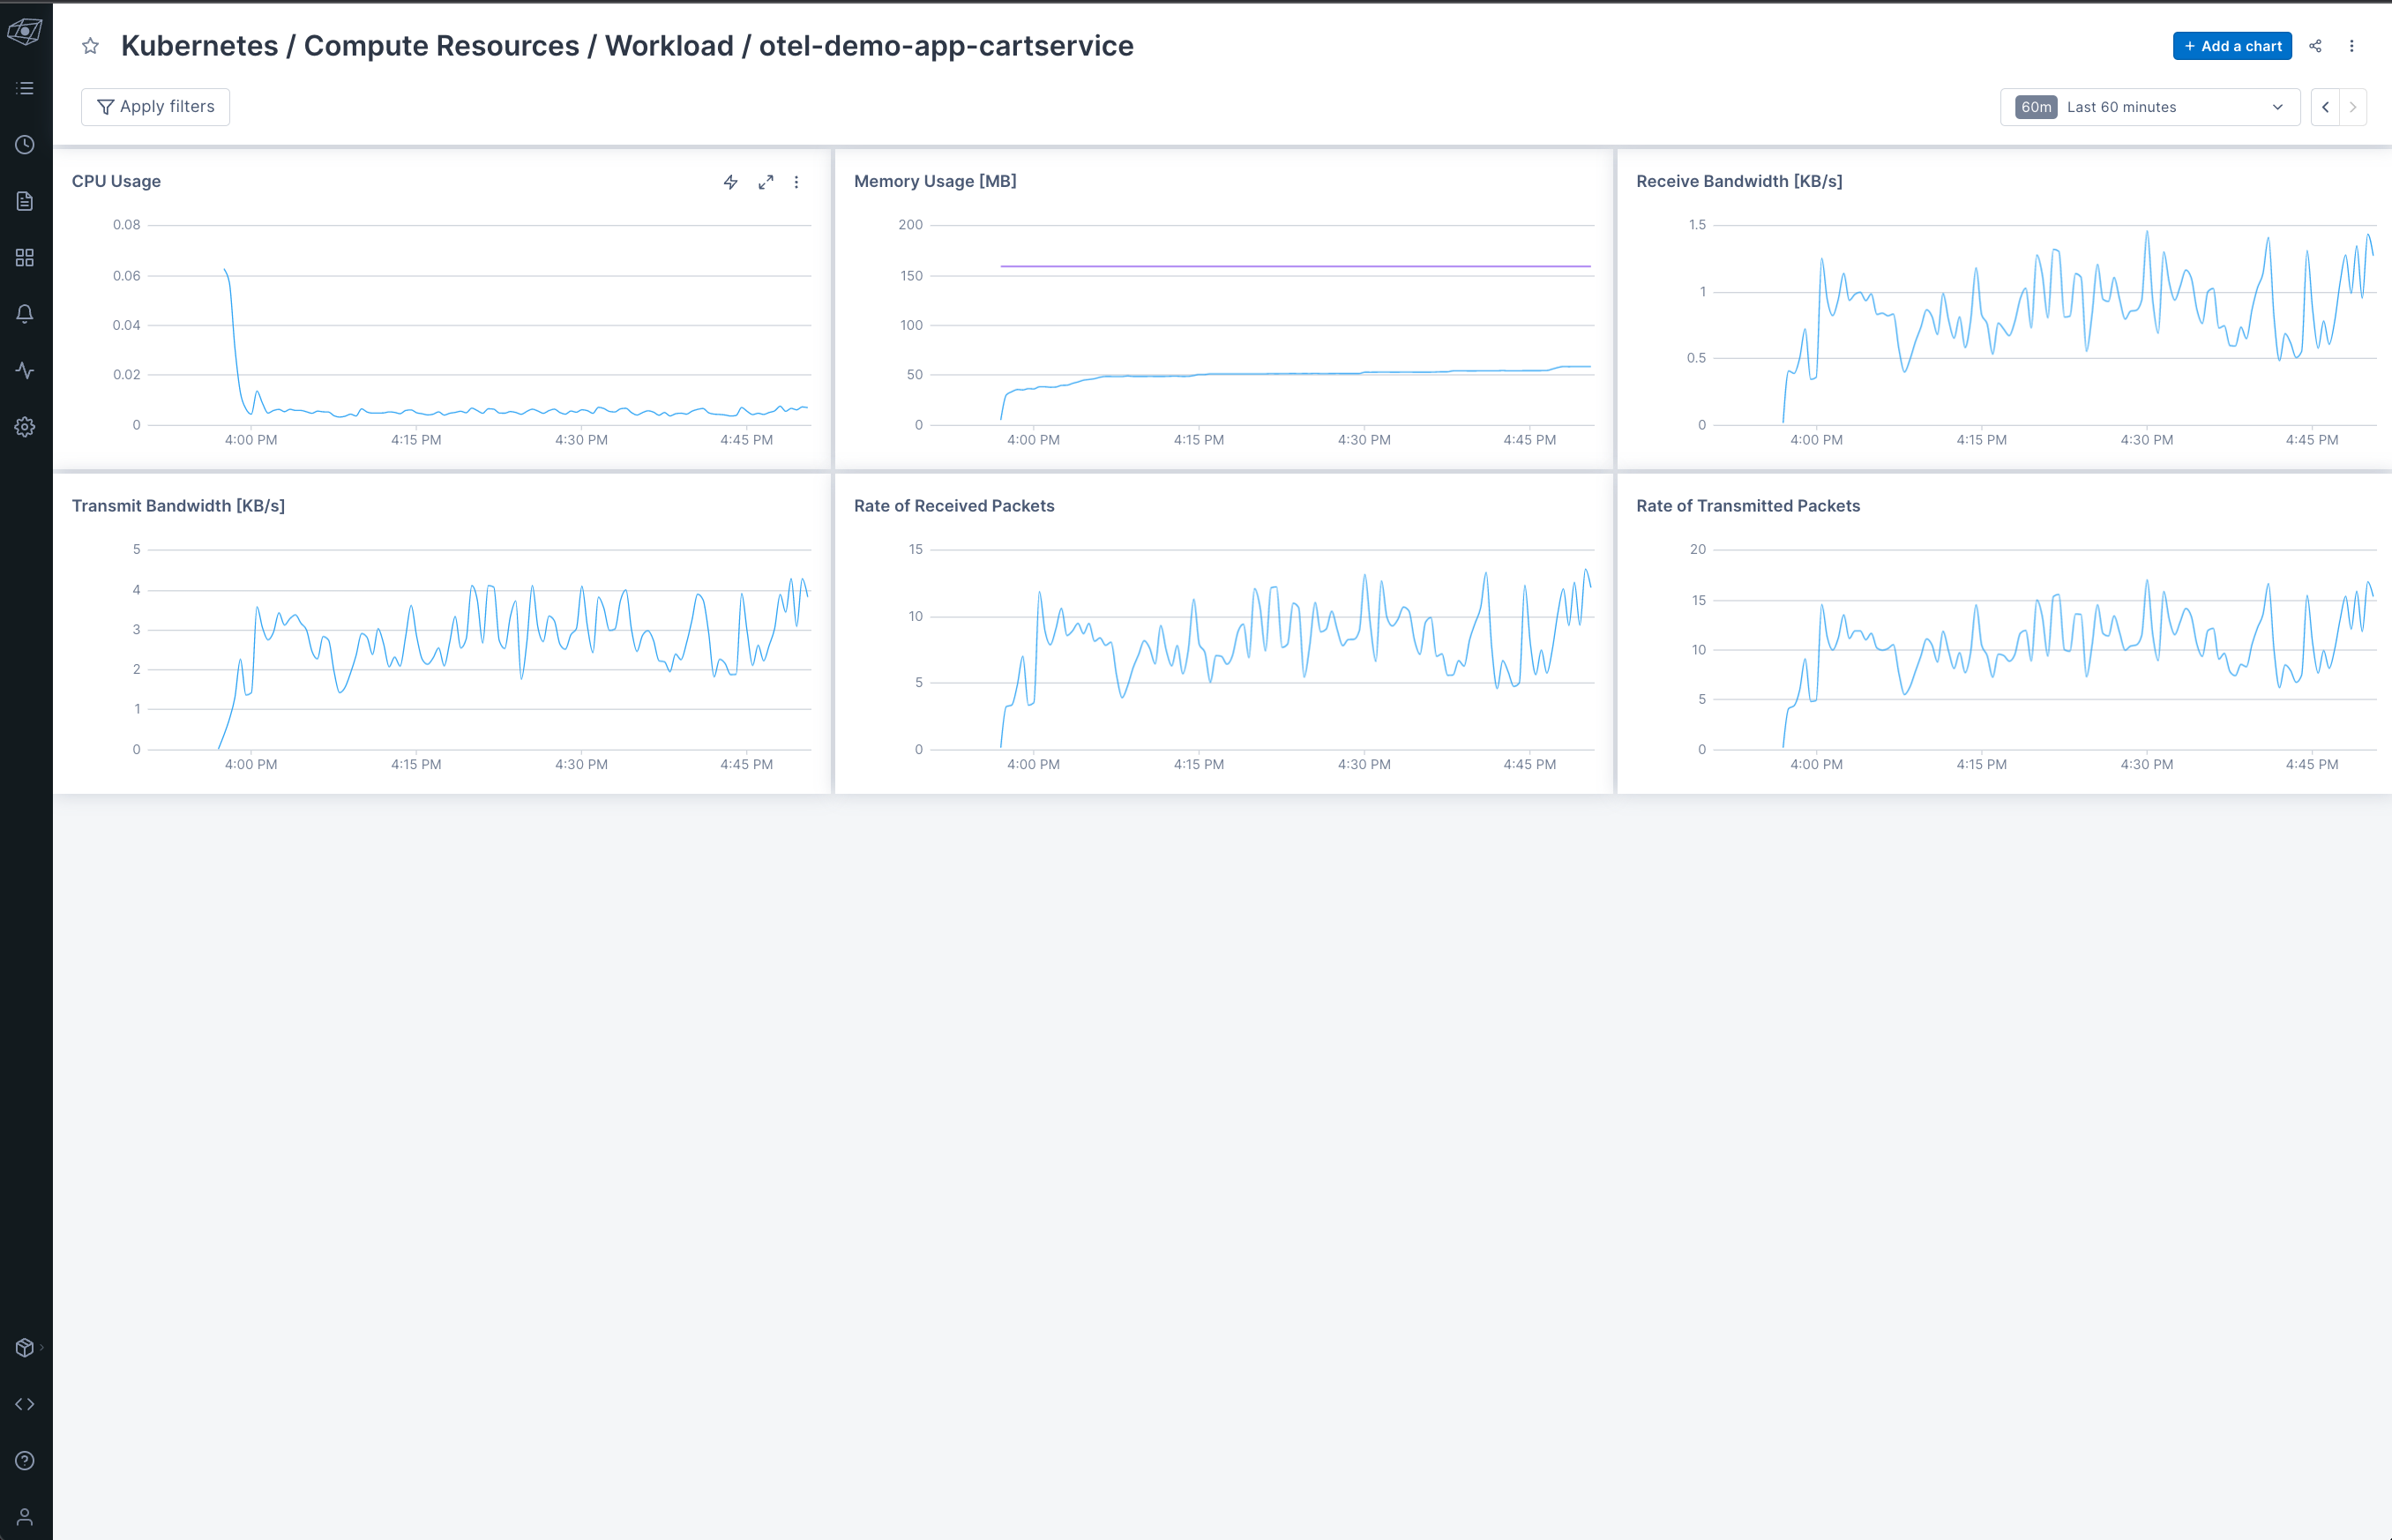
For example, the Kubernetes / Compute Resources / Workload / otel-demo-app-cartservice dashboard displays metrics for the OTel Demo App’s cartservice. In it we can see how our containers and pods are doing based on Metrics such as those for CPU and Memory.
11- See Application Metrics in Lightstep
Ah...but we’re not done with Metrics just yet! If you go back to the dashboard view and scroll to the very end of the list, you’ll see the OTel Demo App - Application Metrics dashboard.
Let’s click on it to take a quick little peek!
The latest version of the OTel Demo App emits both auto-instrumented and manually-instrumented Metrics. In today’s demo, we wanted to highlight some of the Metrics from the recommendationservice.
First, we have the auto-instrumented Python Metrics, which are captured from the Python runtime:
-
runtime.cpython.cpu_time: Track the amount of time being spent in different states of the CPU. This includes user (time running application code) and system (time spent in the operating system). This metric is represented as total elapsed time in seconds. -
runtime.cpython.memory: Memory utilization -
runtime.cpython.gc_count: Number of times the garbage collector has been called.
We also have one manually-instrumented Metric:
-
app_recommendations_counter: Cumulative count of the number of recommended products per service call
For more on the recommendationservice Metrics, check out this doc. For more on Metrics captured by other services, check out the OTel Demo App service docs.
12- Teardown
If you’re no longer using this environment, don’t forget to tear down its resources, to avoid running up a huge cloud bill. You’re welcome. 😉
terraform destroy -auto-approve
This step can take up to 30 minutes, so please be patient! Also, you’ll probably notice that on first run, you’ll see the following error:
Don’t panic! If you run
terraform destroy -auto-approveagain, it will finish nukifying all the things.
Final Thoughts
Today we got to see some aspects of Observability-Landscape-as-Code (OLaC) in practice! Specifically, we looked at the following elements:
- Application instrumentation with OpenTelemetry
- Collecting and storing application telemetry via the OTel Collector
- Configuring an Observability back-end (i.e. Lightstep) through code
We showcased this by using Terraform to:
- Deploy the OpenTelemetry Demo App to Kubernetes. The Otel Demo App showcases the Traces and Metrics instrumentation of different services in different languages using OpenTelemetry.
- Deploy an OpenTelemetry Collector to Kubernetes (part of the Demo App deployment). The Collector is used to send application Traces and Metrics to Lightstep.
- Configure Lightstep dashboards. The Lightstep Terraform provider allowed us to codify this.
Codifying our Observability Landscape means that we can tear down and recreate our application, Collector, and dashboards as needed, knowing that we’ll have consistency across the board every single time. Plus, it means that we can version control it, so that it’s not lost in the ether somewhere, or sitting in a secret server under Bob’s desk. Bonus!
Hopefully this gives you a nice little flavour of the power of OLaC, and will inspire you to go out there and start OLaC-ing too! (I just made up a new verb. You’re welcome.)
Whew! That was a lot to think about and take in! Give yourself a pat on the back, because we’ve covered a LOT! Now, please enjoy this picture of Adriana’s rat, Bunny, enjoying an almond!
Peace, love, and code. 🦄 🌈 💫
The OpenTelemetry Demo App is always looking for feedback and contributors. Please consider joining the OTel Community to help make OpenTelemetry AWESOME!
Got questions about Observability-Landscape-as-Code? Talk to us! Feel free to connect with us through e-mail, or:
Hope to hear from y’all!









Top comments (0)