
Observability
It is a measure of how well internal states of a system can be inferred from knowledge of its external outputs. It helps bring visibility into systems. – Wikipedia
Tracing is one of the important pillars for measuring observability along with logs and metrics. Its a way of thinking about the system, a way of being able to ask the system questions, that you need the answer to when you didn't know the questions beforehand. On the other hand, alerting is a way of asking questions when you do know the question beforehand.
Distributed Tracing can be quite helpful in answering questions for your distributed system like,
- Root cause analysis
- Performance optimisation
- dependency analysis of services
Selenium-4
It has a number of new exciting features and one such is a cleaner code for Selenium Grid along with support for distributed tracing via OpenTelemetry APIs. This is a pretty exciting and important feature for the admins and DevOps engineers to trace the flow of control through the Grid for each and every command.
Distributed tracing has two parts:
Code instrumentation: Adding instrumentation code in your application to produce traces. The major instrumentation parts are done neatly by the developers of the Selenium project, which leaves us to consume it by using Selenium Grid start-up command along with Jaeger.
Collection of data and providing meaning over it, Jaeger has a UI which allows us to view traces visually well.
Steps to start tracing your tests,
Start Jaeger via docker(as it's easy)
Instrument your Selenium Grid start-up command with Jaeger tracing as in start-grid-distributed.sh and start-grid-standalone.sh for standalone mode.
Now execute your tests, and navigate to
http://localhost:16686/to view the outputs.
Pre-requisites
Assuming you have docker running on your machine,
- Install Coursier via homebrew
brew install coursier/formulas/coursier - Install Jaeger via docker
- Selenium-server.jar refers to the latest alpha version of selenium releases (Tested with Alpha 5)
Start Jaeger via docker server
The simplest way to start the all-in-one is to use the pre-built image published to DockerHub (a single command line).
$ docker run --rm -it --name jaeger \
    -p 16686:16686 \
    -p 14250:14250 \
    jaegertracing/all-in-one:1.17
You can then navigate to http://localhost:16686 to access the Jaeger UI.
Instrument your Selenium Grid command
We're going to add support for Open Telemetry API's(one of the many ways to do distributed tracing) using Coursier to generate a full classpath when started this way the selenium server will inform you that it has found a tracer on stdout.
Refer start-grid-distributed.sh if you want to start Grid in distributed mode.
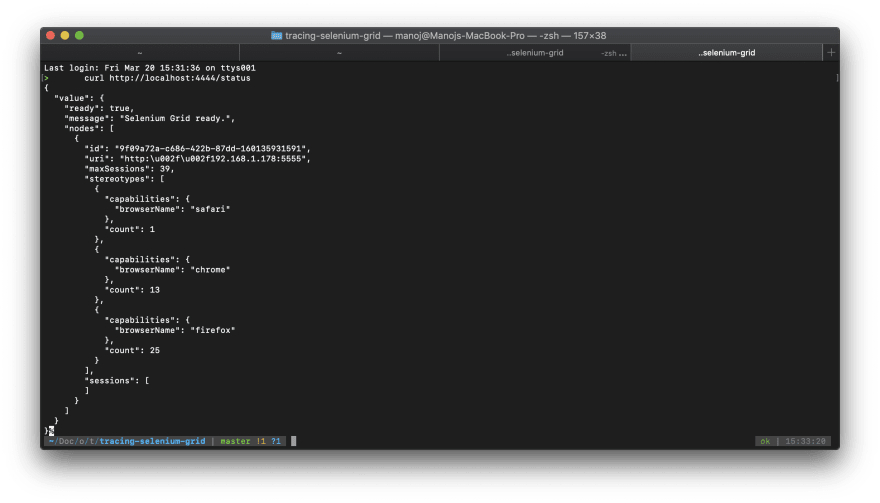
curl http://localhost:4444/status
to check if your grid deployment is ready
Execute your tests
Point your tests as in DistributedTracingExamples Class and navigate to http://localhost:16686/ to view the outputs.
Under services lookup for Selenium-router and notices actions for each call made by your tests. An example below

References:
A special thanks to ever-helpful Simon Stewart
Thanks, folks!
Follow me on Twitter

Top comments (1)
Thanks for this!
Just a quick note for the future: Starting with 0.10.0 the "opentelemetry-exporters-jaeger" package was renamed to "opentelemetry-exporter-jaeger"
mvnrepository.com/artifact/io.open...
This doesn't effect Alpha 7, but will effect the next cut.