0. 前言
這篇文章會分享如何在Kubernete上透過自訂的Prometheus metrics來實作HPA
-- Horizontal Pod Autoscale
首先來講講為什麼會需要custom metrics
很簡單,就是內建的不夠用
其實單純用內建的CPU/Ram作為Scale的指標其實是非常不準確的一件事情。
可參考
Cpu utilization is wrong
Useless metrics
所以針對一些原生K8s沒有提供的指標,像是使用服務的人數,連線的latency等等。
就必須使用Custom Metrics來執行Scaling.
下列操作基於於kubernetes v1.14
1. HPA via Custom Metrics
免不了的,一定得解釋一下HPA透過Custom Metrics做Scaling的機制
單純透過CPU or Ram其實沒甚麼好講的,官方文件跟網路上很多文章講解的都很清楚
其實是我懶得寫
k8s.doc
ithome
重點在於HPA是如何取得Custom Metrics的,以及如何將我們自訂的Metric吐出來給HPA Controller
大致運作邏輯是這樣
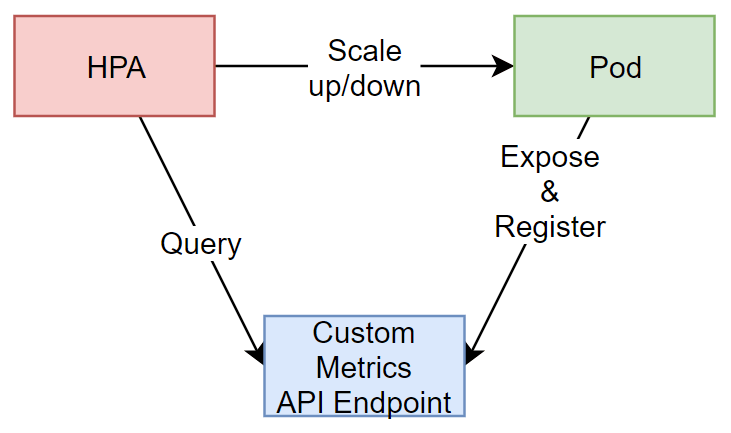
首先講解Custom Metrics的部分,在Kubernetes中,目前有關Custom Metrics的操作主要是對
custom-metrics.metrics.k8s.io/v1beta1
這個API EndPoint來註冊以及取得資料的。
也就是說,我們的Pod暴露出的Custom Metrics要想辦法註冊到這個API Endpoint上
HPA Controller就可以從這個EndPoint取得我們自定的Metrics,來做他該做的事情
2. Prometheus Operator & Prometheus-adapter
先從架設環境開始,在這邊我會透過Prometheus來集中接收Metrics
應用服務對Prometheus暴露Metrics
而會有個Prometheus-adapter把metrics註冊到上述的Endpoint
其實也可以讓應用直接對K8s的Custom API Server直接註冊Custom Metrics
但統一將Metrics 交給Prometheus後,可以更方便我們整合Grafana Dashboard
2.1 安裝Prometheus Operator
Prometheus Operator是由coreOS開發打包推出的
以下是官方的簡介
The Prometheus Operator for Kubernetes provides easy monitoring definitions for Kubernetes services and deployment and management of Prometheus instances.
和一般Prometheus最大的不同,Prometheus Operator會順帶安裝Grafana
並且還多加入了一個Service Monitor
Service Monitor會負責將Pod暴露出來的metric導入到Prometheus內
有點類似prometheus的scrape
我們可以直接用helm安裝prometheus operator
helm install --name po stable/prometheus-operator
安裝好後可以連進prometheus的網頁查看所有的Target是否都能正確取得
如果Kube-proxy有異常的話可參考這邊
2.2 安裝Prometheus-adapter
安裝完Pormetheus Operator後我們打通了Pod export metrics到Prometheus的管道
但還必須將Prometheus內的metrics註冊到k8s的custom metrics API endpoint
同樣的可以透過helm來安裝prometheus-adatper
helm install --name pa stable/prometheus-adapter
要額外注意的一點是prometheus.url和prometheus.port必須配合我們剛剛安裝好的prometheus operator.
可以在安裝的時候指定這些參數
helm install --name pa --set prometheus.url=http://po-prometheus-operator-prometheus.default.svc,prometheus.port=9090 stable/prometheus-adapter
安裝好後可以透過這個指令來從custom metrics api endpoint撈資訊
有噴出一堆東西的話就是安裝成功了
kubectl get --raw /apis/custom.metrics.k8s.io/v1beta1
如果有回傳,但沒看到metrics。表示你的Prometheus Operator有安裝成功,
正確註冊了Custom metrics api endpoint,但Adapter沒有從Prometheus撈到資料註冊回去。
至此為止,加上Prometheus Operator以及Prometheus adapter後
原先的的關係圖會變成這樣子

接下來會介紹如何將metrics expose到Prometheus內
3. Pod exposes custom metrics.
Pod暴露metrics的方法大致可分為幾種
- 透過lib自行輸出metrics 例如 flask_prometheus_metrics 就是會幫你輸出flask裡面的相關指標
- 自己按照Prometheus所需的格式輸出metrics 例如我們接下來用的範例就是如此
- 由Ingress或Service Mesh幫你暴露metrics (可自訂性較低)
3.1 Start a sample Pod.
Create sample-deploy.yaml
apiVersion: apps/v1
kind: Deployment
metadata:
  name: sample-app
  labels:
    app: sample-app
spec:
  replicas: 1
  selector:
    matchLabels:
      app: sample-app
  template:
    metadata:
      labels:
        app: sample-app
    spec:
      containers:
      - image: luxas/autoscale-demo:v0.1.2
        name: metrics-provider
        ports:
        - name: http
          containerPort: 8080
kubectl apply -f sample-deploy.yaml
Create svc.yaml
apiVersion: v1
kind: Service
metadata:
  labels:
    app: sample-app
    release: po
  name: sample-svc
spec:
  ports:
  - name: http
    port: 80
    protocol: TCP
    targetPort: 8080
  selector:
    app: sample-app
  type: ClusterIP
kubectl apply -f svc.yaml
等pod建立好後,可以透過下列指令來觀察pod的metrics
curl http://$(kubectl get service sample-svc -o jsonpath='{ .spec.clusterIP }')/metrics

Output >>>
# HELP http_requests_total The amount of requests served by the server in total
# TYPE http_requests_total counter
http_requests_total 1
3.2 ServiceMonitor
如先前介紹的,Service Monitor主要負責將Pod吐出的資料倒到Prometheus內
類似Scrape的方式
Create service-monitor.yaml
apiVersion: monitoring.coreos.com/v1
kind: ServiceMonitor
metadata:
  labels:
    app: sample-app
    release: po
  name: sample-app
  namespace: default
spec:
  endpoints:
  - port: http
  namespaceSelector:
    matchNames:
    - default
  selector:
    matchLabels:
      app: sample-app
      release: po
kubectl create -f service-monitor.yaml
到這一步需要開啟Prometheus的Dashboard檢查Target內有沒有我們定義的Target
這裡附上ServiceMonitor的除錯方法
其實不外乎就是label沒對上罷了
4. Double Check
做到這邊,我們整個路算是都打通了。
可以從apiserver撈一下,檢查我們的metric有沒有註冊上去
kubectl get --raw "/apis/custom.metrics.k8s.io/v1beta1/namespaces/default/pods/*/http_requests?selector=app%3Dsample-app"
註: 我們安裝prometheus adapter時只用了預設的config,如果你的metric沒有出現。
或是希望在註冊回k8s時要做一些運算,如算rate之類的。
可以參考這邊
5. Create HPA
搞了這麼久終於可以來定義我們的HPA了。
Create and apply sample-hpa.yaml
kind: HorizontalPodAutoscaler
apiVersion: autoscaling/v2beta1
metadata:
  name: sample-app
spec:
  scaleTargetRef:
    # point the HPA at the sample application
    # you created above
    apiVersion: apps/v1
    kind: Deployment
    name: sample-app
  # autoscale between 1 and 10 replicas
  minReplicas: 1
  maxReplicas: 10
  metrics:
  # use a "Pods" metric, which takes the average of the
  # given metric across all pods controlled by the autoscaling target
  - type: Pods
    pods:
      # use the metric that you used above: pods/http_requests
      metricName: http_requests
      # target 500 milli-requests per second,
      # which is 1 request every two seconds
      targetAverageValue: 500m
And try to get our hpa
kubectl get hpa
NAME         REFERENCE               TARGETS   MINPODS   MAXPODS   REPLICAS   AGE
sample-app   Deployment/sample-app   0/500m    1         10        1          24h
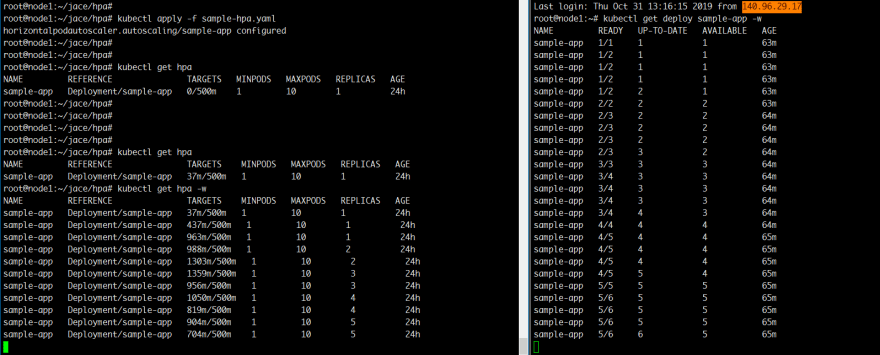
6. Trigger Scale Up.
先開兩個視窗分別觀察HPA以及deployment
watch kubectl get hpa
watch kubectl get deploy sample-app
接著再打一個curl的無窮迴圈
while true; do curl -s "http://$(kubectl get service sample-svc -o jsonpath='{ .spec.clusterIP }')" > /dev/null; done
沒意外的話就會看到HPA被觸發然後進行Scale Up了
7. Misc.
最先是打算做http request latency based HPA的,所以
拿了flask_prometheus_metrics來做範例
其實最後也算是有弄出來,但中間會牽扯到Prometheus adapter的metricsQuery語法撰寫
礙於篇幅的關係就不寫了。
而且發現Prometheus adapter的metricsQuery其實還是有侷限性。
他只能針對一個metric來做rate或是histogram,然後再註冊到K8s custom api endpoint
不像我們用grafana時,可以拿很多metric組合運算得出我們想要的數據
所以就直接用這個例子分享。
結論,最好的方法還是Pod自己就能吐出最終你要註冊到k8s的metric
TroubleShoot
-
Prometheus Operator重裝失敗
再重裝Prometheus Operator時可能會遇到CRD相關的錯誤
先用Helm delete --purge的方式清空
再刪除所有的crd
https://github.com/coreos/prometheus-operator#removal
然後重新安裝時先手動建立CRD
kubectl apply -f https://raw.githubusercontent.com/coreos/prometheus-operator/release-0.32/example/prometheus-operator-crd/alertmanager.crd.yaml
kubectl apply -f https://raw.githubusercontent.com/coreos/prometheus-operator/release-0.32/example/prometheus-operator-crd/prometheus.crd.yaml
kubectl apply -f https://raw.githubusercontent.com/coreos/prometheus-operator/release-0.32/example/prometheus-operator-crd/prometheusrule.crd.yaml
kubectl apply -f https://raw.githubusercontent.com/coreos/prometheus-operator/release-0.32/example/prometheus-operator-crd/servicemonitor.crd.yaml
kubectl apply -f https://raw.githubusercontent.com/coreos/prometheus-operator/release-0.32/example/prometheus-operator-crd/podmonitor.crd.yaml
接著helm install時不要產生CRD
helm install --name po stable/prometheus-operator --set prometheusOperator.createCustomResource=false 我的Prometheus Dashboard內kube-proxy target錯誤
https://github.com/helm/charts/tree/master/stable/prometheus-operator#kubeproxy
Reference
- https://github.com/DirectXMan12/k8s-prometheus-adapter/blob/master/docs/walkthrough.md
- https://github.com/coreos/prometheus-operator
- https://github.com/DirectXMan12/k8s-prometheus-adapter
- https://github.com/helm/charts/tree/master/stable/prometheus-operator
- https://www.youtube.com/watch?v=gSiGFH4ZnS8

Oldest comments (0)