Unveiling the true cost of your ride-sharing and food delivery habits with an ELT data pipeline, PostgreSQL, dbt, and Power BI.

Introduction
As a regular user of Uber and Uber Eats products, I realized that I wanted to gain better insights into how much I spend on these services per month, year, or quarter. As a digital content creator and data engineer, I decided to create a proof-of-concept (POC) for a data analysis project to track my expenses on these platforms.
In this article, I will walk you through the process of building the “My Uber Project” pipeline. This pipeline utilizes an ELT (Extract, Load, Transform) approach to extract data from PDF receipts, clean and structure the data, store the data in a PostgreSQL database, perform transformations using dbt (Data Build Tool), and finally visualize the results with Power BI.
Data Extraction: PDF Receipts
The first step in the My Uber Project pipeline is to extract data from the PDF receipts received via email after each Uber ride or Uber Eats order. To achieve this, we can use Python libraries like PyPDF2 or pdfplumber to parse the PDF files and extract the relevant information.
Data Cleaning and Structuring
After extracting the raw data, the next step is to clean and structure it. This process involves tasks such as parsing dates, converting currencies, and standardizing column names. The cleaned and structured data will be stored in two separate CSV files:
- uber_eats.csv: Contains information related to Uber Eats orders with columns: type, date, total, and restaurant.
- uber_ride.csv: Contains information related to Uber rides with columns: type, date, total, and driver.
import pdfplumberimport reimport osimport pandas as pddef extract_data(pdf_path): with pdfplumber.open(pdf_path) as pdf: page = pdf.pages[0] content = page.extract_text() date_pattern = r'\d{1,2} \w+ \d{4}' date = re.search(date_pattern, content).group(0) total_pattern = r'Total (\d+\,\d{2}) \$CA' total = re.search(total_pattern, content).group(1).replace(',', '.') driver_pattern = r'Votre chauffeur était (\w+)' driver_match = re.search(driver_pattern, content) restaurant_pattern = r'restaurant suivant : (.+?)\.' restaurant_match = re.search(restaurant_pattern, content) if driver_match: return {'type': 'Uber', 'date': date, 'total': total, 'driver': driver_match.group(1)} elif restaurant_match: return {'type': 'Uber Eats', 'date': date, 'total': total, 'restaurant': restaurant_match.group(1)} else: return {'error': 'Invalid receipt format'}pdf_directory = '/home/stefen/uber/data'pdf_files = [f for f in os.listdir(pdf_directory) if f.endswith('.pdf')]uber_data = []uber_eats_data = []for pdf_file in pdf_files: pdf_path = os.path.join(pdf_directory, pdf_file) extracted_data = extract_data(pdf_path) if 'error' in extracted_data: print(f"Error processing file {pdf_file}: {extracted_data['error']}") elif extracted_data['type'] == 'Uber': uber_data.append(extracted_data) elif extracted_data['type'] == 'Uber Eats': uber_eats_data.append(extracted_data)uber_df = pd.DataFrame(uber_data)uber_eats_df = pd.DataFrame(uber_eats_data)uber_df.to_csv('uber_receipts.csv', index=False)uber_eats_df.to_csv('uber_eats_receipts.csv', index=False)
Here’s an explanation of each part of the code:
- Import necessary libraries:
- pdfplumber: To extract text from PDF files
- re: To perform regular expression operations
- os: To interact with the operating system, e.g., working with directories and files
- pandas: To work with data in DataFrame format and save to CSV
- Define the
extract_datafunction that takes a PDF file path as an input: a. Open the PDF file using pdfplumber and get the first page b. Extract the text content from the page c. Use regular expressions to find the date, total, driver (if available), and restaurant (if available) information in the text d. If a driver is found, return the extracted data as a dictionary with the 'type' key set to 'Uber' e. If a restaurant is found, return the extracted data as a dictionary with the 'type' key set to 'Uber Eats' f. If neither a driver nor a restaurant is found, return an error dictionary indicating an invalid receipt format - Specify the directory containing the PDF files and create a list of all PDF files in the directory.
- Initialize empty lists
uber_dataanduber_eats_datato store extracted data. - Iterate through each PDF file in the list, call the
extract_datafunction to extract the data, and append it to the appropriate list based on the 'type' key value. If an error is encountered, print the error message. - Create separate DataFrames for Uber and Uber Eats data using the pandas library.
- Save the DataFrames to CSV files (uber_receipts.csv and uber_eats_receipts.csv) without including the index column.
After the data extraction and processing, the next step is to create the architecture for the PostgreSQL database and pgAdmin. In this section, we will use Docker and docker-compose to set up the services:
version: "3.8"services: postgres: image: postgres:latest environment: POSTGRES_USER: postgres POSTGRES_PASSWORD: mysecretpassword ports: - "0.0.0.0:5432:5432" volumes: - postgres_data:/var/lib/postgresql/data - ./postgres-init:/docker-entrypoint-initdb.d pgadmin: image: dpage/pgadmin4:latest environment: PGADMIN_DEFAULT_EMAIL: admin@example.com PGADMIN_DEFAULT_PASSWORD: mysecretpassword ports: - "8080:80" depends_on: - postgresvolumes: postgres_data:
Once the PostgreSQL database and pgAdmin have been set up, the next step is to initialize and configure our dbt project. After running the dbt init command, we can start setting up the project structure. Here's an overview of the dbt project structure:
C:.├───dbt_packages├───logs├───macros├───models│ ├───intermediate│ ├───marts│ │ ├───eats_dept│ │ └───rides_dept│ └───staging├───seeds└───target ├───compiled │ └───my_uber_project │ └───models │ ├───intermediate │ ├───marts │ │ ├───eats_dept │ │ └───rides_dept │ └───staging └───run └───my_uber_project ├───models │ ├───intermediate │ ├───marts │ │ ├───eats_dept │ │ └───rides_dept │ └───staging └───seeds
The project structure contains the following folders:
-
dbt_packages: Contains packages installed via thepackages.ymlfile. -
logs: Stores log files generated during dbt execution. -
macros: Contains custom macros for the project. -
models: Holds the dbt models, organized into subdirectories for intermediate, staging, and marts (eats_dept and rides_dept) layers. -
seeds: Contains CSV files with seed data to be loaded into the database. -
target: Stores the output of dbt commands (compiled and run). This folder has subdirectories for compiled and run models, each with the same structure as themodelsfolder (intermediate, staging, and marts layers).
By following this structure, we can keep our dbt project organized and easy to maintain. Each subdirectory within the models folder serves a specific purpose, helping to separate different stages of data transformation and analysis.
The profiles.yml file is a configuration file used by dbt to define different environments (called profiles) and their connection settings. In this example, two profiles are defined: dev and prod. Each profile specifies the connection settings for a PostgreSQL database.
profiles.yml file contents:
-
default: The name of the profile group. You can have multiple profile groups if needed. -
outputs: A dictionary containing the different profiles within the group. -
dev: The development profile with the following connection settings:
-
type: The type of database being used (in this case, PostgreSQL). -
threads: The number of concurrent threads dbt should use when executing queries. -
host,port,user,pass,dbname,schema: Connection settings for the PostgreSQL database (host, port, username, password, database name, and schema) in the development environment.
-
prod: The production profile with similar connection settings as thedevprofile. Replace the placeholders ([host],[port],[prod_username],[prod_password],[dbname], and[prod_schema]) with the actual values for your production environment. -
target: Specifies the default target profile to use when running dbt commands. In this case, it is set todev.
By defining different profiles, you can easily switch between development and production environments when running dbt commands, allowing you to test and develop transformations in one environment before deploying them to another. To switch between profiles, you can change the target value in the profiles.yml file or use the --target flag when running dbt commands.
default: outputs: dev: type: postgres threads: 3 host: localhost port: 5432 user: dbt pass: dbt_password dbname: olap schema: public prod: type: postgres threads: 1 host: [host] port: [port] user: [prod_username] pass: [prod_password] dbname: [dbname] schema: [prod_schema] target: dev
Once the dbt project is set up, one of the first things to do is to manage the date format in the Uber receipts, which are in French. To handle the French month names, you can create a custom function in your PostgreSQL database to translate them into English month names. Here’s a step-by-step explanation of the process:
- Connect to your
olapPostgreSQL database using your preferred database client or pgAdmin. - Create a new function called
translate_french_month_to_englishthat accepts a singleTEXTparameter representing the French month name. - Inside the function, use a
CASEstatement to map the French month names (in lowercase) to their corresponding English month names. - Return the translated English month name or
NULLif no match is found. - The function is defined using the
plpgsqllanguage.
Here’s the SQL code for the function:
CREATE OR REPLACE FUNCTION translate_french_month_to_english(month TEXT)RETURNS TEXT AS $$BEGIN RETURN CASE WHEN lower(month) = 'janvier' THEN 'January' WHEN lower(month) = 'février' THEN 'February' WHEN lower(month) = 'mars' THEN 'March' WHEN lower(month) = 'avril' THEN 'April' WHEN lower(month) = 'mai' THEN 'May' WHEN lower(month) = 'juin' THEN 'June' WHEN lower(month) = 'juillet' THEN 'July' WHEN lower(month) = 'août' THEN 'August' WHEN lower(month) = 'septembre' THEN 'September' WHEN lower(month) = 'octobre' THEN 'October' WHEN lower(month) = 'novembre' THEN 'November' WHEN lower(month) = 'décembre' THEN 'December' ELSE NULL END;END;$$ LANGUAGE plpgsql;
By adding this function to your PostgreSQL database, you can easily translate the French month names in your Uber receipts data to their English counterparts. This will help standardize the date format and make it easier to work with the data in dbt and other data processing tools.
Once the translate_french_month_to_english function is created, you can now create your first staging models for both Uber Eats and Uber rides data. In each model, you will use the custom date parsing function to convert the French date format to a standardized format.
- Create a new model for staging Uber Eats data:
{{ config(materialized='table') }}SELECT *, {{ parse_custom_date('date') }} as transaction_dateFROM {{ ref('uber_eats') }}
This model uses the parse_custom_date macro (which should be defined in your macros folder) to convert the French date format in the date column. The resulting standardized date is stored in a new column called transaction_date.
- Create a new model for staging Uber rides data:
{{ config(materialized='table') }}SELECT *, {{ parse_custom_date('date') }} as transaction_dateFROM {{ ref('uber_ride') }}
With the staging models in place, run the following dbt commands:
-
dbt seed: This command loads the seed data from the CSV files in theseedsfolder into your database. -
dbt run: This command executes the models in your project. It will create the staging tables for both Uber Eats and Uber rides data, applying the custom date parsing to standardize the date format.
After creating the staging models, you can create an intermediate model called uber_transactions.sql in the models/intermediate folder. This model combines the Uber Eats and Uber rides data into a single table, which can be useful for further analysis and reporting. Here's a breakdown of the code in this model:
- Set the materialization type to ‘table’ using the
configfunction:
{{ config(materialized='table') }}
2. Create a Common Table Expression (CTE) named eats:
WITH eats AS ( SELECT 'eats' as type, transaction_date, total, restaurant FROM {{ ref('uber_eating') }}),
This CTE selects data from the uber_eating staging model, adding a new column called type with a value of 'eats' to identify the source of the data.
3. Create another CTE named rides:
rides AS ( SELECT 'rides' as type, transaction_date, total, driver FROM {{ ref('uber_riding') }})
Similar to the eats CTE, this CTE selects data from the uber_riding staging model and adds a type column with a value of 'rides' to identify the source of the data.
4. Combine the eats and rides CTEs using the UNION ALL operator:
SELECT *FROM eatsUNION ALLSELECT *FROM rides
The UNION ALL operator combines the results of the two SELECT statements into a single result set. This will create a single table containing both Uber Eats and Uber rides data, with the type column indicating the source of each row.
Full-Code:
-- models/intermediate/uber_transactions.sql{{ config(materialized='table') }}WITH eats AS ( SELECT 'eats' as type, transaction_date, total, restaurant FROM {{ ref('uber_eating') }}),rides AS ( SELECT 'rides' as type, transaction_date, total, driver FROM {{ ref('uber_riding') }})SELECT *FROM eatsUNION ALLSELECT *FROM rides

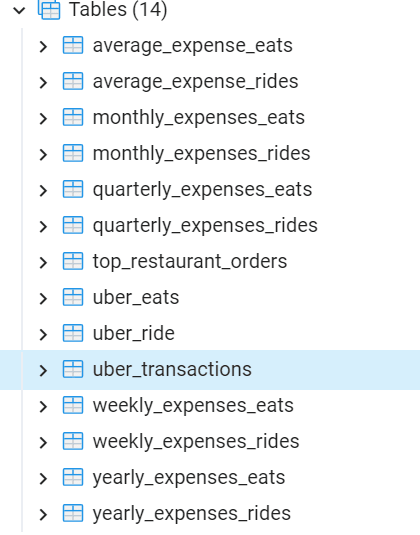
After creating the intermediate model, the next step is to create a series of models. These models will generate various aggregated metrics for the rides data, such as average expense, and expenses by week, month, quarter, and year.
Here’s a brief overview of the models:
-
average_expense_rides.sql: Calculates the average expense of Uber rides. -
monthly_expenses_rides.sql: Aggregates the total expenses of Uber rides on a monthly basis. -
quarterly_expenses_rides.sql: Aggregates the total expenses of Uber rides on a quarterly basis. -
weekly_expenses_rides.sql: Aggregates the total expenses of Uber rides on a weekly basis. -
yearly_expenses_rides.sql: Aggregates the total expenses of Uber rides on a yearly basis.
By creating these models, with power bi you can analyze and visualize various aspects of your Uber rides expenses over different time periods. This will provide a comprehensive understanding of your Uber rides expenditure patterns and help you make more informed decisions about your transportation budget.
In conclusion, this project demonstrates the process of building a data pipeline for analyzing Uber and Uber Eats expenses. By leveraging tools such as Python, PostgreSQL, dbt, and Power BI, you can extract, clean, and transform data from various sources, then visualize it in a way that provides valuable insights.
Throughout this project, you:
- Extracted data from Uber and Uber Eats PDF receipts using Python and pdfplumber.
- Created a PostgreSQL database and a pgAdmin container using Docker Compose.
- Loaded the extracted data into the database and configured a dbt project.
- Created a custom PostgreSQL function to handle date translations from French to English.
- Built a series of dbt models for staging, intermediate, and aggregated data.
- Analyzed and visualized the data using Power BI (not covered in detail here but assumed as part of the project).

Top comments (0)