According to Wikipedia, apophenia is “the tendency to mistakenly perceive connections and meaning between unrelated things” . It is also used as “the human propensity to seek patterns in random information”. Whether it’s a scientist doing research in a lab, or a conspiracy theorist warning us about how “it’s all connected”, I guess people need to feel like we understand what’s going on, even in the face of clearly random information.
Deep Neural Networks are usually treated like “black boxes” due to their inscrutability compared to more transparent models, like XGboost or Explainable Boosted Machines.
However, there is a way to interpret what each individual filter is doing in a Convolutional Neural Network, and which kinds of images it is learning to detect.
Convolutional Neural Networks rose to prominence since at least 2012, when AlexNet won the ImageNet computer vision contest with an accuracy of 85%. The second place was at a mere 74%, and a year later most competitors were switching to this “new” kind of algorithm.
They are widely used for many different tasks, mostly relating to image processing. These include Image Classification, Detection problems, and many others.
I will not go in depth into how a Convolutional Neural Network works, but if you’re getting started in this subject I recommend you read my Practical Introduction to Convolutional Neural Networks with working TensorFlow code.
If you already have a grasp of how a Convolutional Neural Network works, then this article is all you need to know to understand what Feature Visualization does and how it works.
How does Feature Visualization work?
Normally, you would train a CNN feeding it images and labels, and using Gradient Descent or a similar optimization method to fit the Neural Network’s weights so that it predicts the right label.
Throughout this process, one would expect the image to remain untouched, and the same applies to the label.
However, what do you think would happen if we took any image, picked one convolutional filter in our (already trained) network, and applied Gradient Descent on the input image to maximize that filter’s output , while leaving the Network’s weights constant?
Suddenly, we have shifted perspectives. We’re no longer training a model to predict an image’s label. Rather, we’re now kind of fitting the image to the model, to make it generate whatever output we want.
In a way, it’s like we’re asking the model “See this filter? What kind of images turn it on?”.
If our Network has been properly trained, then we expect most filters to carry interesting, valuable information that help the model make accurate predictions for its classification task. We expect a filter’s activation to carry semantic meaning.
It stands to reason then, that an image that “activates” a filter, making it have a large output, should have features that resemble those of one of the objects present in the Dataset (and among the model’s labels).
However, given that convolutions are a local transformation , it is common to see the patterns that trigger that convolutional filter repeatedly “sprout” in many different areas of our image.
This process generates the kind of picture Google’s Deep Dream model made popular.
In this tutorial, we will use TensorFlow’s Keras code to generate images that maximize a given filter’s output (namely, the filter’s ouputs’ average, since the output is technically a matrix).
Implementing Filter Visualization
As I mentioned before, for this to work we would need to first train a Neural Network classifier. Luckily, we don’t need to go through that whole messy and costly process: Keras already comes with a whole suite of pre-trained Neural Networks we can just download and use.
Using a Pre-trained Neural Network
For this article, we will use VGG16, a huge Convolutional Neural Network trained on the same ImageNet competition Dataset. Remember how I mentioned AlexNet won with an 85% accuracy and disrupted the Image Classification field? VGG16 scored 92% on that same task.
VGG16 is a convolutional neural network model proposed by K. Simonyan and A. Zisserman from the University of Oxford in the paper “Very Deep Convolutional Networks for Large-Scale Image Recognition”. The model achieves 92.7% top-5 test accuracy in ImageNet, which is a dataset of over 14 million images belonging to 1000 classes. It was one of the famous model submitted to ILSVRC-2014. It makes the improvement over AlexNet by replacing large kernel-sized filters (11 and 5 in the first and second convolutional layer, respectively) with multiple 3×3 kernel-sized filters one after another. VGG16 was trained for weeks and was using NVIDIA Titan Black GPU’s.
https://neurohive.io/en/popular-networks/vgg16/ — VGG16 – Convolutional Network for Classification and Detection (emphasis mine)
For these experiments I will be using Google colab’s GPU machine, and tweaking Keras Library’s example of Filter Visualization code.
For a breakdown of how the original script works, you can see Keras Blog. I only made slight changes to it to easily configure file names, and other minor details, so I don’t think it’s worth it to link to my own notebook.
What the important function does is:
- Define a loss function that’s equal to the chosen filter’s mean output.
- Initialize a small starting picture , typically with random uniform noise centered around RGB(128,128,128) (I actually played around with this a bit, and will expand on it later).
- Compute the gradient of the input picture with regards to this loss, and perform gradient descent
- Repeat N times, then resize the picture to make it slightly bigger (default value was 20%). We start with a small picture and make it increasingly bigger as we generate the filter’s maximizing image, because otherwise the algorithm tends to create a small pattern that repeats many times, instead of making a lower-frequency pattern with bigger (and, subjectively, more aesthetically pleasing) shapes.
- Repeat the last two steps until reaching the desired resolution.
That’s pretty much it. The code I linked to has a few more things happening (image normalization, and stitching together many filters’ generated images into a cute collage) but that is the most important bit.
Here’s the code for that function, not that scary now that you know what’s going on right?
Now for the fun part, let’s try this out and see which kinds of filters come out.
My Results Trying out Feature Visualization
I read many different examples of Feature Visualization articles before giving it a shot. Here are some of the things I learned.
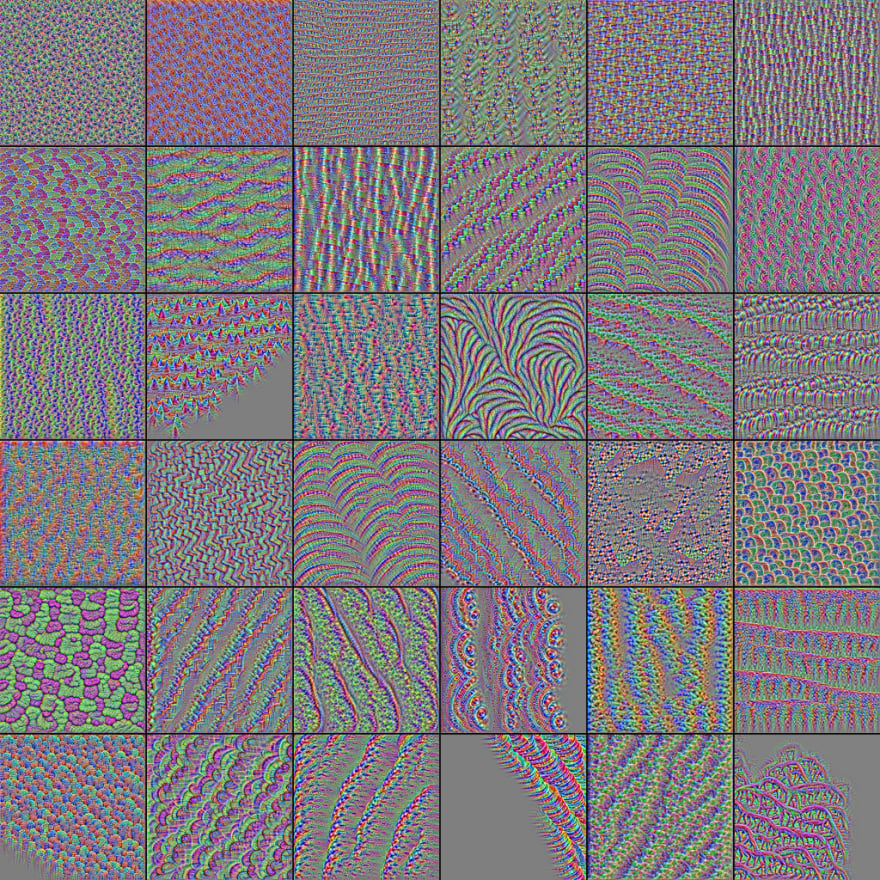
- The first Convolutional Layers (the ones closer to the inputs) generate simpler visuals. They’re usually just rough textures like parallel wavy lines, or multicolored circles.

- The Convolutional layers closer to the outputs generate more intricate textures and patterns. Some even resemble objects that exist, or sorta look like they may exist (in a very uncanny-valley kind of way).
This is also where I had the most fun, to be honest. I tried out many different “starting images”, from random noise to uniform grey, to a progressive degrade.
The results for any given filter all came out pretty similar. This makes me think given the number of iterations I used, the starting image itself became pretty irrelevant. At the very least, it did not have a predictable impact on the results.


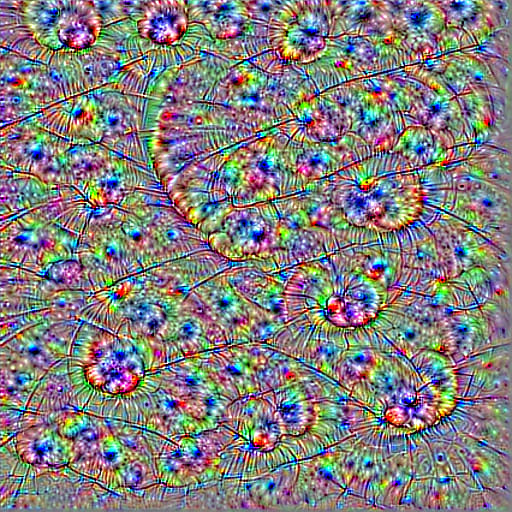
As we go deeper, and closer to the fully connected layers , we reach the last Convolutional Layer. The images it generates are the most intricate by far, and the patterns they make many times resemble real life items.


Now, looking into these images in search of patterns, it is easy to feel like one is falling into apophenia. However, I think we can all agree some of those images have features that really look like … you can zoom in and complete that sentence on your own. Feature Visualization is the new gazing at clouds.
My own guess is it’s just a new kind of abstract art.
Let me show you some of the filters I found most visually interesting:


I have about 240 more of these, if there’s enough interest I can make a gallery out of them, but I feared it may turn repetitive after a while.
- Finally, If you use the classification layer’s cells to generate an image, it will usually come out wrong, greyish and ugly. I didn’t even try this out, since the results weren’t that interesting. It’s good to keep it in mind however, especially when you read headlines about AI taking over soon or similar unwarranted panic.
Conclusion
To be honest, I had a lot of fun with this project. I hadn’t really heard about Google Colab until a couple weeks ago (thanks to r/mediaSynthesis). It feels great to be able to use a good GPU machine for free.
I’d also read most of the papers on this subject a couple years ago, then never got around to actually testing the code or doing an article like this. I’m glad I finally scratched it out of my list (or Trello, who am I kidding?).
Finally, in the future I’d like to try out different network architectures and visualize how the images morph at every iteration, instead of simply looking at the finished product.
Please let me know in the comments which other experiments or bibliography could be worth checking to keep expanding on this subject!
If you liked this article, please consider tweeting it or sharing anywhere else!
Follow me on Twitter to discuss any of this further or keep up to date with my latest articles.
The post Feature Visualization on Convolutional Neural Networks (Keras) appeared first on Data Stuff.


Latest comments (0)