
Debugging - we have all been there. Staring at lines of code for hours on end wondering why something broke the way it did. Debugging automation code can be a frustrating and mentally exhausting experience. No matter the toolset, rooting through lines of code to determine where automation broke down is challenging.
I personally am guilty of spotting an error, then immediately running my code again. For some reason I continue to think that the second time around my code will pass without issue. As if a 50% failure rate is anything to feel confident about - it is not.
Thankfully, Cypress comes with methods and features which greatly increase an engineer's ability to successfully debug automation code in a quick and efficient manner.
This tutorial assumes familiarity with Cypress and with test automation. We will use the DemoQA Elements page as a basis for our testing and debugging activities.
Setting Up the Debugger
In order to properly debug using Cypress, you must configure the browser window to open with developer tools. This can be done by adding the following code to your index.js module within the plugins directory.
NOTE: Launching a browser instance without the above inside of your plugins index.js module (or without the console manually opened) will not allow for debugging to take place.
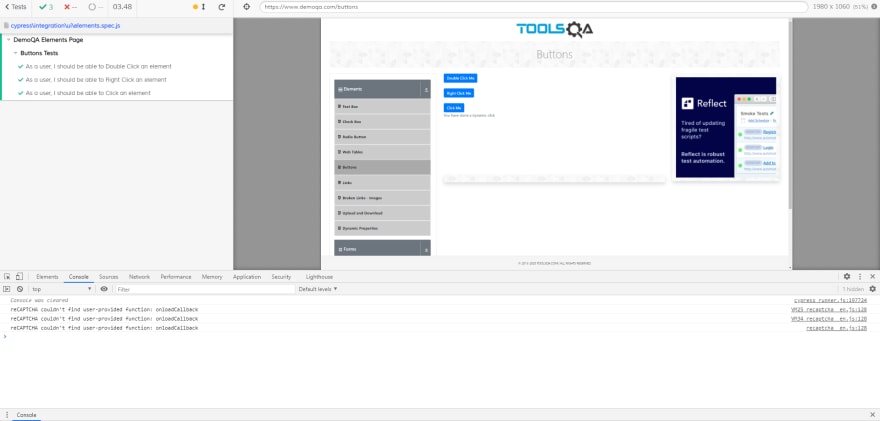
You can verify the code has worked by opening the Cypress GUI and running a test in headful mode. The browser window should now open with developer tools prominently displayed.
Debugging Methods
Cypress allows for two separate debug methods:
- JavaScript
debuggerstatement - Cypress’
cy.debug()method
I have personally found the Cypress cy.debug() method to be much more useful to a testing engineer so I will be focusing on its usage over the debugger statement. This is largely due to the fact that Cypress captures element criteria when the debug method is called.
For example, you are building a test for selecting the dynamic click button on the DemoQA Buttons page. The dynamic click button is the third button shown on the page, below the double click and right click buttons. Writing out a simple call to get a button and click it fails as there is more than one button element on the page.
A quick and easy way to find which button to select would be to use the debug method immediately after getting all buttons on the page.
Running the above code will return the following in your browser window:
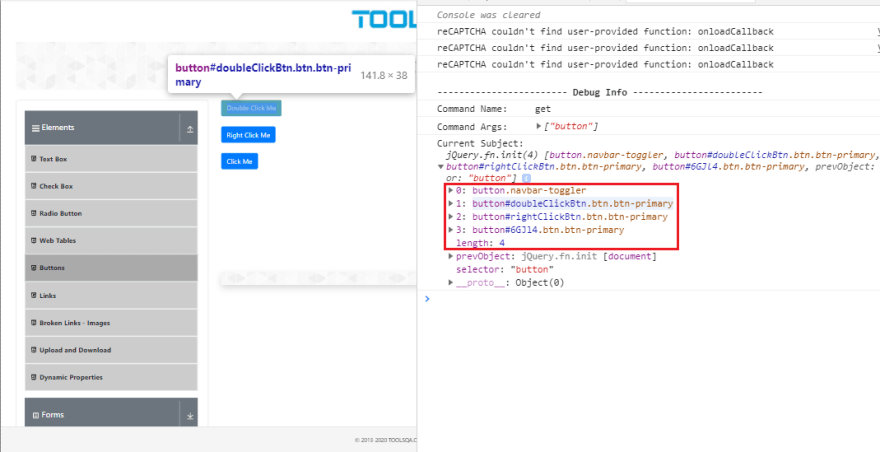
As you can see, there are four buttons on the page with the dynamic click button occupying the third index. Opening the index within the console shows information for the selector, ranging from childNodes and innerText, to onClick data. For this particular issue, we will focus on the innerText entry as the button has a unique text node that we can work with.
Using the cy.contains() method with the text “Click Me” is not going to work in this instance, as there are three buttons with “Click Me” on the screen. Instead, we will resort to using a regex pattern and match it to the exact contents of the innerText data found when using the debug method.
Our test will now pass without issue as we are selecting the correct button on the screen.
This may seem like a rudimentary example. The intention is to demonstrate the practice of using the cy.debug() method for finding element criteria which can help build a selector for test consumption.
Past and Present
One of the original features that drew me to adopt Cypress version 1.0.0 was the before and after DOM screenshots for page actions. Prior to Cypress, engineers would relied on two patterns for debugging via image screenshot:
- Manually enter screenshot calls within the test code
- Screenshot on after failure calls
The trouble with the first was that it required the engineer to know specifically where to enter the screenshot call. In extreme cases, engineers would add screenshot calls before and after every action. Each automation run would then fill a directory with screenshots to sift through without context, further muddying the engineer’s ability to accurately troubleshoot automation issues.
Screenshot on failure was only useful to determine application state when the action failed. It was not at all helpful with viewing application state prior to the failure.
Cypress solves these issues by providing DOM screenshots before and after an action is taken on the page. Below is an interaction on the DemoQA Buttons page. When a user double clicks on a specific button, a message is shown in a container below the button rows.

The gif shows the Cypress test runner with “before” and “after” buttons at the bottom of the screen. The “before” button shows application state prior to action while the “after” button shows the result. Toggling the “after” button displays a screenshot with message text stating that a double click has occurred on the correct button, thereby confirming that a double click has taken place on the page.
While this information is only available when running in headful mode, it allows an engineer to review actions that have been taken within the application and the application’s state immediately prior. This can prove to be extremely helpful during debugging by providing a base for when to add cy.debug() methods.
Capture It On Video
By default in headless mode, Cypress captures video files for each test which has completed — whether it passes or fails. These videos can provide a glimpse into application state during the test while showing the overall workflow under test. Engineers can use these videos to quickly spot errors within application state, taking into consideration what actions are occurring so as to mark where debug statements need to be entered.
As a test engineer, you should be reviewing the videos after every failure in order to determine where to begin troubleshooting. While they are not interactive, they do provide adequate context.
Pause for Effect
Many programming languages feature a Read-Evaluate-Print Loop (REPL) which allows an engineer to step into the code during execution. From here, the engineer can write out steps and watch the result of their commands in real time. I am intimately familiar with this pattern as a good portion of my automation experience is with Python and Ruby, both programming languages that feature REPLs.
Each language allowed me to write automation code, open a headful window, then step into it using binding.pry for Ruby and breakpoint for Python, respectively. Once inside, I could write out the code for the next step of the test within the REPL and watch the results of my interactions. This process allowed me to see the actions execute and what sort of issues I should be looking for, such as slow-loading elements that need to be waited upon.
Unfortunately, JavaScript does not feature a REPL. However, the creators of Cypress did provide us with an alternative: the cy.pause() method.
Using the pause method stops your automation code and provides two additional features:
- A play button
- A next button
The play button will simply run the test as normal. It is the next button that is critical to troubleshooting automation code.
Here is the button in action:

Using the next button, we can view the action and result for each step of code in our test. This is extremely powerful as it allows the engineer the ability to view results outside of the confines of video or screenshots. Instead of static assets, the engineer is directly controlling Cypress. This is perfect for troubleshooting page loads, finicky selectors, or all manner of other issues.
I personally use this pattern whenever I find myself troubleshooting with Cypress, no matter the size of the issue. The cy.pause() method is far too powerful to not use when writing or maintaining automation code.
Summary
Debugging test automation does not have to be a painful experience. By using Cypress’ debug method, you can spy application elements for use within test automation code. Reviewing DOM screenshots and videos allows you to build context for entering debug statements. Finally, the cy.pause() method is a powerful tool which allows an engineer to step into the test code as it runs and manually execute test steps.
Each of these tools will greatly enhance your ability to troubleshoot and debug automation code.
Resources
- “Debugging.” Cypress Documentation, 5 Mar. 2021, docs.cypress.io/guides/guides/debugging.html.
- Cypress-Io. “Proposal: Add Command-Line Flag for Opening Dev Tools during Run · Issue #2024 · Cypress-Io/Cypress.” GitHub, github.com/cypress-io/cypress/issues/2024.
This article was originally published on Medium.
Jonathan Thompson is a Senior Quality Engineer at Pendo.io specializing in test automation. He currently resides in Raleigh, NC with his wife and a Goldendoodle named Winston. You can connect with him on LinkedIn, or follow him on either Twitter or Github.

Top comments (0)