Web Scraping is a technique that makes possible to extract data from HTML files. This resource was widely used by Google to create its search engine, based in the href tag they would know the most popular links, following new links and rank the pages based on how many times it was referred.
Here we're going to learn how to make web scraping with Python in just 3 steps, but before we go on, let meet the page we're going to explore.
INUMERÁVEIS
Inumeráveis (means innumerable) is a page created in Brazil to be a memorial dedicated to the history of each of the victims of the coronavirus in Brazil.
The site presents the age of the victim and it's a value that our health system isn't making public. Questioning myself about the lethality by age I thought about making a scraping to get an idea about this number.
The page shows the victim age aside the name (red circle):

We need to identify the HTML tag that holds the value, so we need to inspect it:
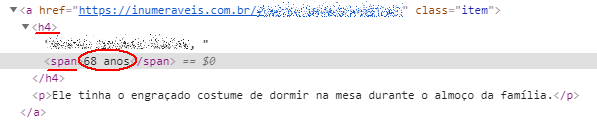
Now we know that the value we're looking for is inside a h4 > span tag, we can start constructing our scraping in three simple steps:
STEP 01: Get the HTML
# pip install requests BeautifulSoup4 matplotlib

from requests import get
from requests.exceptions import RequestException
from contextlib import closing
from bs4 import BeautifulSoup
import matplotlib.pyplot as plt

def simple_get(url):
    try:
        with closing(get(url, stream=True)) as resp:
            if is_good_response(resp):
                return resp.content
            else:
                return None

    except RequestException as e:
        log_error('Error during requests to {0} : {1}'.format(url, str(e)))
        return None


def is_good_response(resp):
    content_type = resp.headers['Content-Type'].lower()
    return (resp.status_code == 200
            and content_type is not None
            and content_type.find('html') > -1)


def log_error(e):
    print(e)


html = BeautifulSoup(simple_get("https://inumeraveis.com.br/"), 'html.parser')
This step uses the BeautifulSoup to parse our raw HTML content returned by the simple_get function in a form that we can use it programmaticaly.
STEP 02: Collect and sort the data
ages = {}

for item in html.select('h4 span'):
    ano = int(item.text.replace(' anos', ''))
    if ano not in ages.keys():
        ages[ano] = 1
        continue
    ages[ano] = ages.get(ano) + 1

ages = sorted(ages.items(), key=lambda x: x[0])
print(ages)
xAge = []
yCount = []
for key, value in ages:
    print(f'Idade: {key} Ocorrências: {value}')
    xAge.append(int(key))
    yCount.append(int(value))
The most important step, here we are searching for the data (age) that we need and we are creating a new data that is the number of times that an age appears (count), furthermore we're sorting the list of ages by its age (lambda expression) so we can use it to plot our graphic.
STEP 03: Plot the graphic
def createGraphic(xAge, yCount):
    fig, ax = plt.subplots()
    ax.bar(xAge, yCount, align='center', alpha=0.5)
    ax.set_xlabel('x - idade')
    ax.set_ylabel('y - quantidade')
    plt.title('Quantidade de mortes por idade - COVID-19')
    ax.xaxis.set_ticks(xAge)
    ax.yaxis.set_ticks(yCount)
    ax.legend()
    plt.gca().margins(x=0)
    plt.gcf().canvas.draw()
    tl = plt.gca().get_xticklabels()
    maxsize = max([t.get_window_extent().width for t in tl])
    m = 0.4
    s = maxsize / plt.gcf().dpi * len(xAge) + 15 * m
    margin = m / plt.gcf().get_size_inches()[0]
    plt.gcf().subplots_adjust(left=margin, right=1. - margin)
    plt.gcf().set_size_inches(s, plt.gcf().get_size_inches()[1])
    plt.show()


createGraphic(xAge, yCount)
In this third and last step we're ploting a graphic with the collected data, for it we're using the matplotlib library. Here i'm using a bar graphic.
The reason that this code becomes a bit large is because of some more steps taken to enlarge the labels text. Now the generated graphic:

The project code is accessible here.
Conclusion
Looking at the graphic was possible to see that the age group with highest risk is in its Sixty-ish, but almost all ages represents risk, we could see that the youngest victim was 18 years old only and the oldest 103 years old. The numbers show that there's not a safe zone, but maybe a slight dangerous zone, so what we really learned here is: #StayHomeStaySafe

Top comments (0)