As Developers, many of us daily work with logical statements and conditions in the applications we build. Sometimes while building a use case with so many logical conditions, it starts to puzzle us. This is primarily due to a lack of visualization. This will eventually lead to taking an excessive amount of our time if we don't have a proper flow chart to visualize our use case looks.
There are many products and npm packages in the market that can help us build a dynamic logical flowchart when we feed our logical conditions. Some of them support only React, and some are paid and not affordable. This is a problem for indie devs working on Angular.
Today, we are going to take a look at an npm module named Mermaid. Mermaid is a Javascript-based diagramming and charting tool that uses Markdown-inspired text definitions and a renderer to create and modify complex diagrams. It's a free tool, and we will be using this to build our dynamic logical flowchart. All the tools analyzed are available in references at the end of this tutorial for you to explore.
In this tutorial, let’s learn how to create a dynamic logic flowchart in AngularJS.

Note: In this tutorial, we will be using the Top-down orientation flowchart. There are various other orientations, charts, and diagrams. Users can implement their own design by following the main documentation for various other themes and configurations. We are using Angular in this tutorial to implement the same.
Steps to create a mermaid logical flowchart:
To start with, create an Angular project and install the npm module for a mermaid:
npm install mermaid --save
- Next, we have to add the module in the component.ts file.
import { Component, OnInit } from '@angular/core';
import mermaid from 'mermaid';@Component({
selector: 'app-root',
templateUrl: './app.component.html',
styleUrls: \['./app.component.scss'\]
})
- Now we have to initialize the mermaid tool in the ngOnInit function. The tool supports various configurations and settings. Users can take a look at their documentation page which will be provided below for further customization.
ngOnInit(): void {
   mermaid.initialize({});
}
- Next, we have to create a function for providing logical conditions to the mermaid tool to render and build a flowchart out of it.
export class AppComponent implements OnInit {flowChart: any;
stringFlowChart: any = "";constructor() {
   this.createFlowchart();
}ngOnInit(): void {
   mermaid.initialize({});
}createFlowchart() {
   this.flowChart = \[
      "graph TD",
       "id1\[Start\] --> id2\[Ques 1\]",
       "id2 --> id3\[Ques 2\] & id4\[Ques 3\]",
       "id3 & id4 --> id5\[Ques 4\]",
       "id5 --> id6",
       "id6\[Ques 5\] --> id7\[End\]",
       "id6 --> id2"
   \]; this.stringFlowChart = this.flowChart.join("\\n");
 }
}
- The array ‘this.flowchart’ contains logical conditions that point from one question id to another. For the mermaid to render the flowchart, it needs the input to be in string format. We will join the array using (“\n”) newline character and form a string to support this.
- Logics can be dynamically build using the above format. ‘Graph TD’ means Graph in Top-Down orientation. Ids have to be unique for each label. Arrow is used to point one label to another. Labels are described in the square brackets [] or rounded brackets (). This decides how the design of the label looks. [] for a sharp square edge while () for a rounded edge.
- We can add themes, font style, colors to text and backgrounds, etc. More customization can be done using the documentation provided. Below you can find a sample code for themes and colors.
createFlowchart() {
   this.flowChart = \[
      "%%{init: {'theme': 'base', 'themeVariables': {
      'primaryColor': 'rgba(229,96,115,.06)' , 'primaryTextColor' :
      '#e56073', 'font-family': '-apple
       system,BlinkMacSystemFont,segoe
       ui,Oxygen,Ubuntu,Cantarell,fira sans,droid sans,helvetica
       neue,sans-serif'}}}%%",
       "graph TD",
       "id1\[Start\] --> id2\[Ques 1\]",
       "id2 --> id3\[Ques 2\] & id4\[Ques 3\]",
       "id3 & id4 --> id5\[Ques 4\]",
       "id5 --> id6",
       "id6\[Ques 5\] --> id7\[End\]",
       "id6 --> id2"
   \];this.stringFlowChart = this.flowChart.join("\\n");
 }
}
- Next, we have to integrate the stringFlowchart to Html component file.
<div class="row">
   <div class="col-12" style="text-align: center;">
      <h3>Logical Flowchart</h3>
      <div style="margin-top: 50px;">
         <pre class="mermaid">
            {{stringFlowChart}}
         </pre>
      </div>
   </div>
</div><router-outlet></router-outlet>
Implementation of Logical Flowchart in BlockSurvey
Questions in forms and surveys are difficult to visualize when there is logic built into it. You can read about skip logic in surveys to know more about this feature. BlockSurvey’s users faced this problem of visualizing, and it was stressful to validate what was built. Today, we have solved this using Mermaid after analyzing all the packages available in the market.
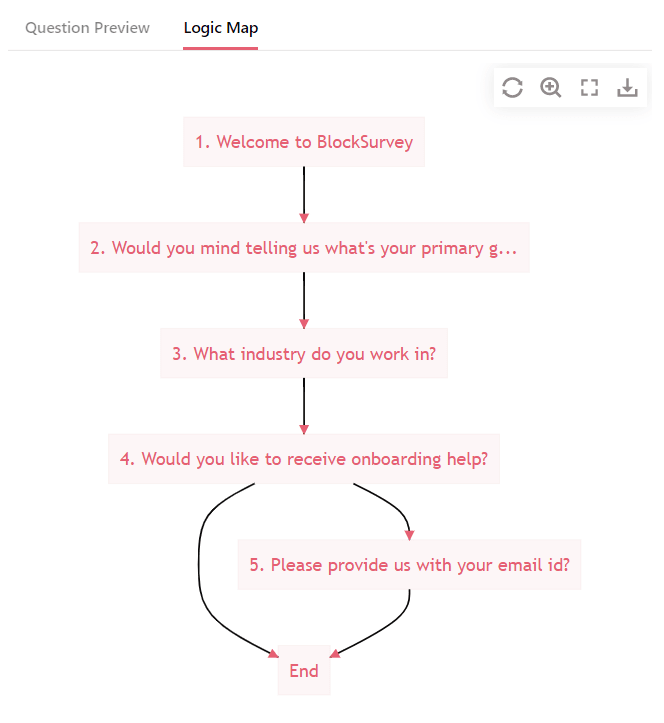
Screenshots from BlockSurvey’s Logic Map implemented using Mermaid.
Logical flowchart using Mermaid
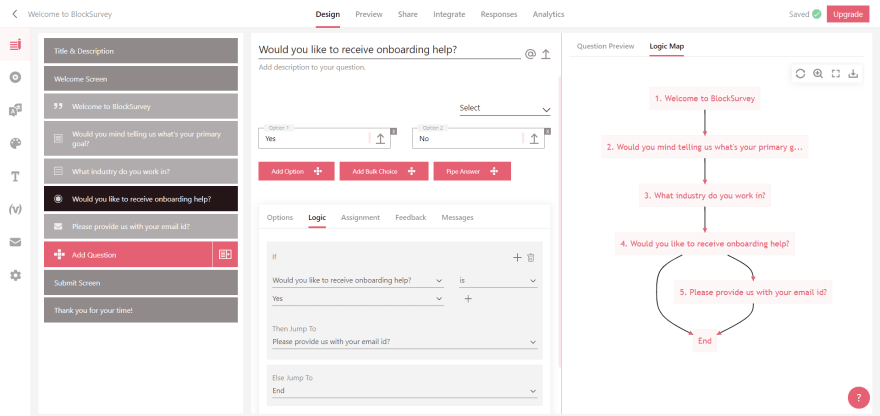
Implementation of Logic Map in BlockSurvey
Summary
Using the mermaid npm module, we can easily create a dynamic logical flowchart. It helps us visualize a clear picture of how the use case will look, and it gives us a better view when we work with complex logic and conditions.
Visualization helps users validate correctness, immediate feedback from eagles view, makes you creative, and saves time.
Give Mermaid a try in your application. Let us know what you think about it.
Thanks for reading. Looking forward to your feedback in the comments.

Top comments (0)