Google Chrome is currently one of the most popular web browsers used by developers today. The Chrome DevTools can greatly improve your workflow by helping you develop, test and debug your websites right within your browser.
However, there are tons of tips and tricks that we don't know about it which can help us even further. Just because we don't see them in menus doesn't mean we shouldn't use them to boost our productivity.
So I got inspired by VS Code can do that series by by Burke Holland and Sarah Drasner and decided to write about these here. Hope it helps you as it's helping me and many others day by day 👌.
Are you ready? Here we go:
Screen shots
You can capture a full page screen shot or what is in the screen without any extension. Simply press CTRL+Shift+P for windows and Cmd+Shift+P for Mac users, to open up the command pallet and type screenshot to see the menu of three options:
- Capture full size screenshot
- Capture screenshot
- Capture node screenshot
Selecting any of those options will save an image of the website to your computer.
Drag and Drop in elements panel
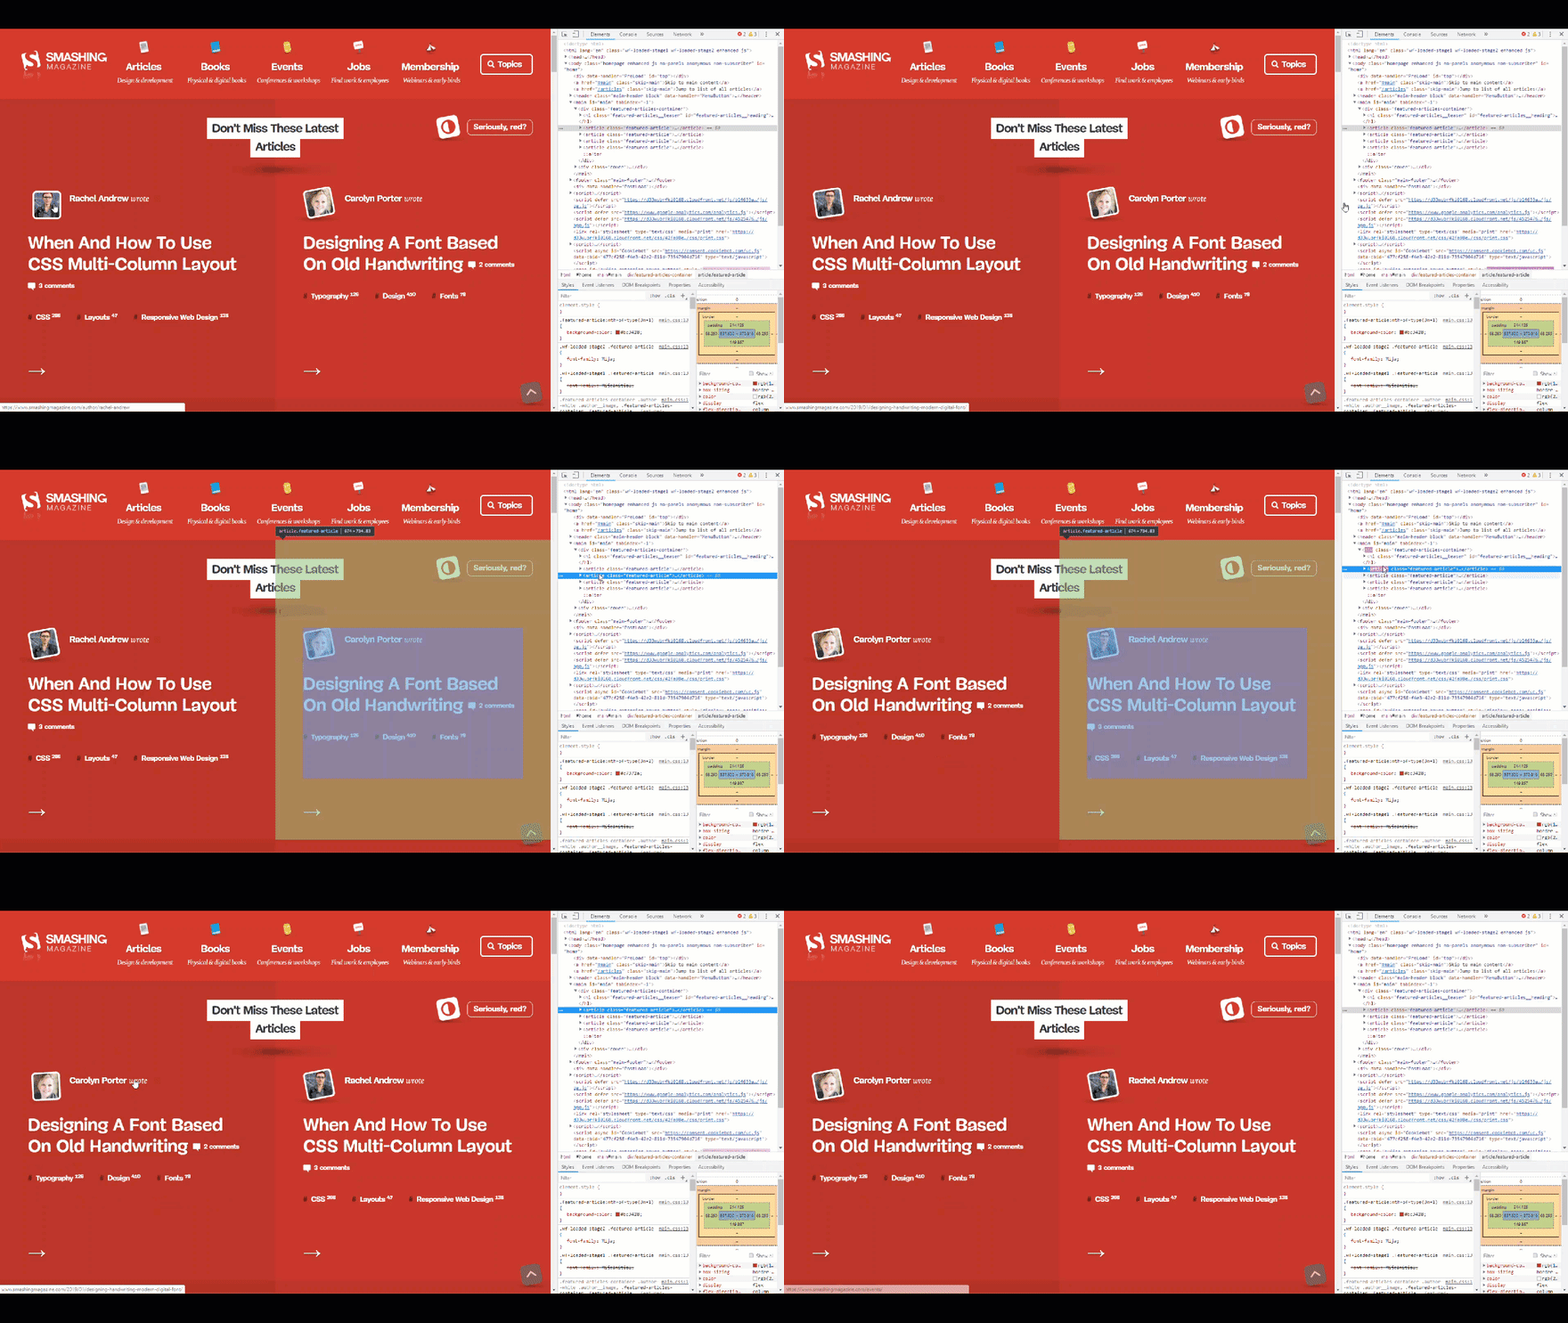
I didn't know this until last week and it's awesome. You can drag and drop elements wherever you want inside elements panel and it would reflect the changes in the page. It's very good if you want to quickly see how things look like with small changes.
Pretty Print { } minified source code
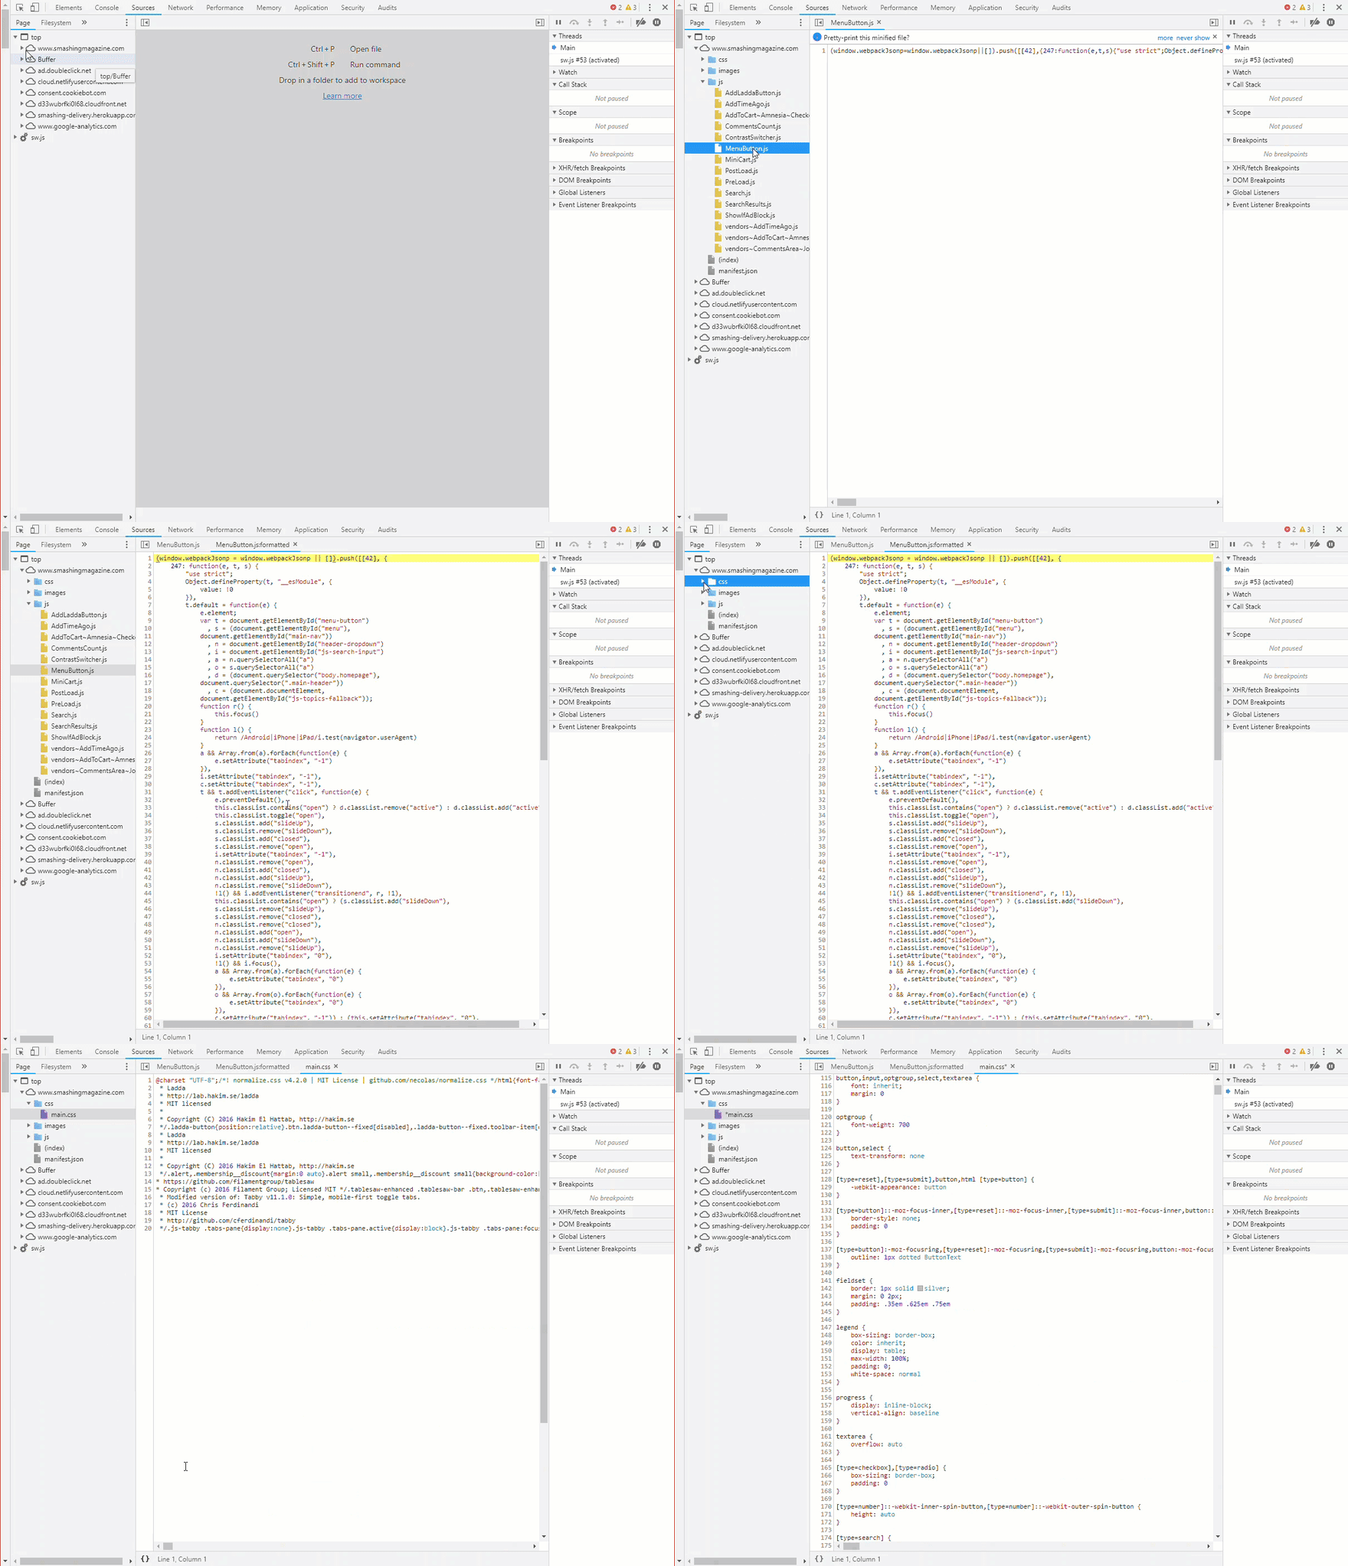
Sometimes you like to see the source code formatted like the original code. This makes more sense in terms of CSS rules or code which is not uglified. This built in feature has saved me some time when debugging CSS rules. Simply press {} at the bottom of the page.
Reference the selected element in console
Sometimes you might want to manipulate an element using JavaScript rather than changing the HTML inside element panel.
Watch expressions
Many times you would like to watch a particular expression to see how it changes under certain circumstances. This is really easy, simply add the expression to watch section:
And as you saw you can see the last expression using $_.
Snippets
We all have some repetitive piece of code we use time to time. From a template for an click handler to a document ready function, it can be anything really. That's where the code snippets section comes in handy. You can store a snippet and use it real easy. Just open the snippet section and click new. Write your snippet down and whenever you want to use it, press Ctrl+Enter for windows and Cmd+Enter for Mac users, or right click and press run.`
Overriding location
If you are writing a web application with information depending where the user is, you might want to check the app behaves as expected with user's location. That's where location override in Chrome DevTools is very useful. Simply press Ctrl+Shift+P for windows and Cmd+Shift+P for Mac users, to open the command pallet, type sensors, and then select a different location from override location drop down. You can even set it to a custom latitude and longitude if you have them.
Editing any text on screen
Sometimes you have a limited width and want to see how a long text looks like on the page. Or you simply are checking whether ellipsis appear if the text is long enough. Chrome DevTools has a feature called design mode which you can set it on in the console and then change any text you want and watch the changes on the fly. Super cool right? 😎
That's it for this post. Keep an eye out for the next post 👀.


Top comments (17)
Love this post! Design Mode seems infinitely useful.
With snippets, it was really simple for me to write a quick one-liner to toggle this on or off. And, since you can run any snippet directly from the command palette, I can now easily switch between "edit" mode and "read" mode.
PSA: Open the command palette, delete the leading
>and enter a!to see all your saved snippets. Simply pick one from the list to execute!Nice tip on accessing the snippets!
CTRL+P will open command palette without the leading
>, I'm guessing it's CMD+P on MacI'm lousy with the conversions, but I believe you are correct that the command palette is opened with
CMD + Pon Mac devices.Thanks you for pointing this out!
You can also right-click an element and select "export to global variable" and the element (and its current state) is stored as
temp1useful if you want to compare the element to an earlier point after making a change.Design mode <3 Mad love :D :D
Nice! The designMode will be a great touch when showing how a feature will look like for the designers instead of the boring and confusing DOM/DOM text editing :)
A feature that is helping me is the
Ctrl+Shift+Ffor searching in the source, then you just need to prettify and add your breakpoint.Nice article. One thing on "Chrome DevTools has a feature called design mode" : no, it is HTML5 that has it. There are extensions on the Chrome store to enable a one-click access, not featured in Chrome DevTools.
Thanks for pointing this out, will update the post once further reading about it ☺️
A really interesting topic! It is kinda hard to keep it up with the latest updates. So is good to have a summary from time to time, good article.
Have you checked the "Local Overrides"? that is one of the features that I like the most.
I am gathering a list fo the next post. Will add this in thanks
If you select a tag in the "elements" tab and go to the "Console" tab and typ "$0" you will get the selected tag
Wow, i could only give you one heart.
Really nice post
Thanks for your kind words, these are the encouragement I need to continue writing
Great article! I didn't know that I could override the location, that's awesome :)
I didn't know you could fake the location, or that there was a command palette. Nice.