K-Means Clustering
For my build week project for cs34 unit 1, I have decided to recreate the K-Means clustering algorithim without using any standard toolkits.
What is K-means clustering?
K-Means clustering is a popular unsupervised algorithim that is very simple and easy to use. The point of using K-means is simple: group similar data points together and discover underlying patterns. What K-means essentially does is it looks for a fixed number (k) of clusters in a dataset in order for it to group similar data points.
why is it helpful?
The K-means clustering algorithm is used to find groups (clusters) which have not been explicitly labeled in the data. This can be used to confirm assumptions about what types of groups exist or to identify unknown groups in complex datasets.
Examples of K-Means clustering
The K-Means clustering algorithm can be used for the following:
- Behavioral segmentation
- Symptomatic Clustering
- Inventory categorization
- Sorting sensor measurements
- Detecting anomalies
Terminology
Before we dive into the algorithm and my python code, lets discuss the terminology that's important for this Algorithm
- K - The K in K-Means clustering stands for number of clusters. For my algorithm it's one of the inputs provided by the user
- Centroid - A Centroid is a geometric center of given points. It's arithmetic mean position of all given points
- Euclidean Distance - The Euclidean distance between two points in either the plane or 3-dimensional space measures the length of a segment connecting the two points. The Pythagorean Theorem can be used to calculate the distance between two points. If the points (x1, y1) and (x2, y2) are in 2-dimensional space, then the Euclidean distance between them is √((x2 - x1)² + (y2 - y1)²)
- Tolerance - A value to see if algorithm has converged. If the error is greater than the give tolerance value, continue running the algorithm until it gets below the tolerance value
- Maximum Iterations - Maximum number of times we need to run the algorithm until the error gets below the give tolerance value.
Getting Started
To get started, I am creating a two dimensional dataset with 50 points/observations. I am creating these randomly using np.random(). Each of the values of X and Y are between 0 and 10.
import matplotlib.pyplot as plt
import numpy as np
from matplotlib import style

#random numbers multiplied by 10 to give us a more diverse group
X = np.random.rand(50, 2) * 10

plt.scatter(X[:,0], X[:,1], marker="x", color='b', s=100, linewidths=5)

plt.grid()
plt.show()
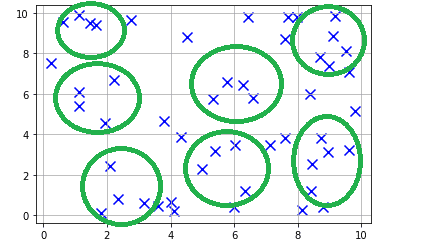
Here is the data chart the shows the randomly generated data

As you can see from the data, we can group some of these points into clusters. For our example let's choose 7 clusters. If we manually tag them as clusters, it would look something like this:
Now how do we get to this without manually grouping these points into clusters?
Before we get started, I would like to describe 3 parameters (more details are provided above)
- K - Number of clusters
- tolerance - Tolerance for the error
- max_interations = Maximum number of times we need to run the algorithm until the error gets below the give tolerance value
    def __init__(self, k=3, tolerance=0.0001, max_iterations=100):
        self.k = k
        self.tolerance = tolerance
        self.max_iterations = max_iterations
Our process to start clustering starts with defining Centroids. Because we choose 7 clusters(k=7) that means we need to have 7 Centroids. A Centroid is a geometric center of given points. Since our data is random, we could have chosen any 7 points as our centroids. But in order to show case how centroids move, I have pre-defined by centroids as following
initial_centroids =  {0:[1, 1], 1:[2, 2], 2:[3, 3], 3:[4, 4],
4:[5, 5], 5:[6 , 6], 6:[8, 8]}
It doesn't matter what centroids we start with. It matters where we end with.
So using these centroids, let's take a look at how our chart looks like with the data. I have used different shape for each of the centroids and color coded them to see which cluster of points associated with those centroids. We need to calculate the Euclidean distances(please see the definition above) between the data points and initial set of centroids
for featureset in data:
  distances = [self.calc_euclidean_distance(featureset,
  self.centroids[centroid]) for centroid in self.centroids]
  cluster_id = distances.index(min(distances))
  self.clusters[cluster_id].append(featureset)
and this is what we get
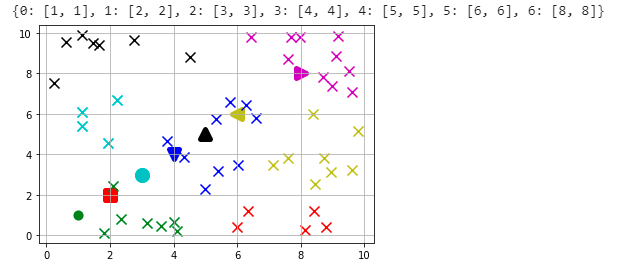
As you can see from the initial centroids we have provided, the centroids are not aligned with the clusters. So we need to start moving the centroids closer to their clusters.
for cluster_id in self.clusters:
   self.centroids[cluster_id] = np.average(self.clusters[cluster_id], axis=0)
Let's take a look at how it looks after updating our centroids

As you can see we are far from getting Centroids closer to where we need them to be. So lets run some more iterations util we get the results we want. But we need to know when we have good results. That can be determined by tolerance and max number of iterations. If we our error rate is not less than tolerance, then we keep going and we stop when we reach max number of iterations configured.
if np.sum((current_centroid -
   original_centroid)/original_centroid*100.0) > self.tolerance:
   optimized = Fals
For this example, it took me about 7 iterations to achieve what we want

As you can from the above picture, our clusters are nicely aligned with our centroids. While these clusters are slightly different from what we have manually tagged, you can see that our machine learning algorithm did a better job of clustering them
Now that we have trained our Centroids based on the initial data, lets see how it predicts for new data points
Y = np.array([[3,3],
              [2,8],
              [7,2],
              [6,6],
              [9,9],
              [8,4],
              [2,4]])

i = 0
for y in Y:
    cluster_id = model.predict(y)
    c = color_dict[cluster_id]
    plt.scatter(y[0], y[1], marker="*", color=c, s=150, linewidths=5)
    i +=1

plt.grid()
plt.show()
The results show that the data we have selected have been clustered the way we expected them to.

Conclusion
K-Means clustering is a very simple unsupervised ML algorithm to create clusters of data that's not been manually tagged. But K-Means clustering has it's own issues. When we use lot of new data, the Centroids might not be where we want them to be because we have trained them using a smaller dataset. When we have large data it's important to re-cluster them
Here is my complete code
import numpy as np

class K_Means:

    initial_centroids = None

    def __init__(self, k=3, tolerance=0.0001, max_iterations=100):
        self.k = k
        self.tolerance = tolerance
        self.max_iterations = max_iterations

    def set_initial_centroids(self, initial_centroids):
      if len(initial_centroids) == self.k:
       self.initial_centroids = initial_centroids

    def fit(self, data):

        self.centroids_all = []

        if self.initial_centroids is None:
          self.centroids = {}
          for i in range(self.k):
              self.centroids[i] = data[i]
        else:
          self.centroids = self.initial_centroids

        print ("Initial centroids", self.centroids)

        for i in range(self.max_iterations):
            self.clusters = {}

            for i in range(self.k):
                self.clusters[i] = []

            for featureset in data:
                distances = [self.calc_euclidean_distance(featureset, self.centroids[centroid]) for centroid in self.centroids]
                # print("Distances", distances)
                cluster_id = distances.index(min(distances))
                # print("Cluster_id", cluster_id)
                self.clusters[cluster_id].append(featureset)

            prev_centroids = dict(self.centroids)
            self.centroids_all.append(dict(self.centroids))

            for cluster_id in self.clusters:
                self.centroids[cluster_id] = np.average(self.clusters[cluster_id], axis=0)

            optimized = True

            for i in self.centroids:
                original_centroid = prev_centroids[i]
                current_centroid = self.centroids[i]
                # print("Orginial, Current", original_centroid, current_centroid)
                if np.sum((current_centroid - original_centroid)/original_centroid*100.0) > self.tolerance:
                    optimized = False

            if optimized:
                break

    def calc_euclidean_distance(self, x1, x2):
        return (sum((x1 - x2)**2))**0.5

    def predict(self, data):
        distances = [self.calc_euclidean_distance(data, self.centroids[centroid]) for centroid in self.centroids]
        cluster_id = distances.index(min(distances))
        return cluster_id

Oldest comments (0)