When working on a project that involves conveying data in a succinct, meaningful way, it can be very useful to include charts. Visually-representing data in charts and graphs brings color to a website, draws the user in, and breaks up what could otherwise be hard-to-follow text.
While there are a number of JS/React libraries that do data visualization, I came across CanvasJS, which I found to be easy to use and highly effective. In this blog I will walk through how to implement CanvasJS in your React project.
Installation
In your React application's src folder, create two files: canvasjs.react.js and canvasjs.min.js. You can find the content of those files by downloading CanvasJS's tutorial here, or you can find the code on my Github (here for canvasjs.react.js, and here for canvasjs.min.js).
Determine the Kind of Chart You Need
There are many different kinds of charts you can implement using ChartJS, including line, area, column and bar, pie and funnel, financial, scatter and bubble, and box and whisker charts. It is important to recognize that not all charts convey the same kind of information, nor do they all convey information equally effectively, depending on what kind of data you're using. There are a number of important points to keep in mind when deciding what kind of chart you should be using, which are summed up very succinctly by Dr. Andrew Abela in this diagram:

It's important to keep in mind that these are all suggestions, and therefore you may create a chart, only to realize that that it's not as easy to read and comprehend as it could be.
Once you determine what kind of chart is best for your project, you can read more about what is needed for the CanvasJS implementation here.
Example Walk Through: Column Chart
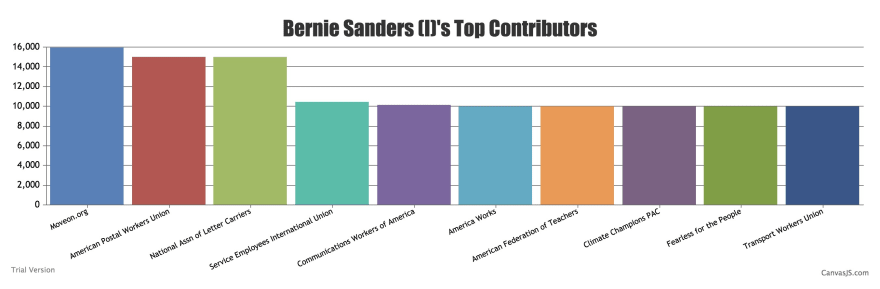
For a project I was recently working on, I wanted to show who a federal legislator's top financial contributors were. I felt that this information was best conveyed as a column chart. Below, I will walk through how I implemented that code and used the chart as a component.
Below is a file tree that includes the relevant components needed for this chart:
  - App.js
      - Search.js
         - CandidateCard.js
            - Contributors.js
               - ContributionChart.js
In other words, App.js renders a component called , which renders , which renders , which renders . ContributionChart.js is where I included the CanvasJS code.
In my project, I would pass down two props from to : an array of objects which are the contributors (and contains information including contributor name and amount contributed), and a string that is the candidate's name.
On CanvasJS's website, they included code for a simple column chart with some starter data:
class App extends Component {
  render() {
    const options = {
      title: {
        text: "Basic Column Chart in React"
      },
      data: [{
                type: "column",
                dataPoints: [
                    { label: "Apple",  y: 10  },
                    { label: "Orange", y: 15  },
                    { label: "Banana", y: 25  },
                    { label: "Mango",  y: 30  },
                    { label: "Grape",  y: 28  }
                ]
       }]
   }

   return (
      <div>
        <CanvasJSChart options = {options}
            /* onRef = {ref => this.chart = ref} */
        />
      </div>
    );
  }
}
I, however, needed my component to iterate through an array of objects, and then each of those objects would be a different 'dataPoint', which contained both a label and a y-coordinate. I also wanted the title's text to have a dynamic title depending on the props passed into it.
In order to iterate through my array of objects, I created a function in the ContributionChart class called eachContributor which maps through the contributors prop, and returns a single data point. Then, in render, dataPoints is set equal to this.eachContributor(). In order to dynamically display the title of the chart, I simply passed the props into the text. Here is my final code:
import React, { Component } from "react";
import CanvasJSReact from "../canvasjs.react";
// var CanvasJS = CanvasJSReact.CanvasJS;
var CanvasJSChart = CanvasJSReact.CanvasJSChart;

class ContributionChart extends Component {
  eachContributor = () => {
    return this.props.contributors.map(contributor => {
      return { label: contributor.org_name, y: parseInt(contributor.total) };
    });
  };
  render() {
    const options = {
      title: {
        text: `${this.props.candidate_name}'s Top Contributors`
      },
      data: [
        {
          type: "column",
          dataPoints: this.eachContributor()
        }
      ]
    };

    return (
      <div className="contributionChart">
        <CanvasJSChart
          options={options}
          // onRef = {ref => this.chart = ref}
        />
      </div>
    );
  }
}

export default ContributionChart;
Here is an example of one chart that was rendered using this component, after making an API call to OpenSecrets.org:
If you're interested, the repository for this project is available here:
Open Secrets Browser
Welcome to the Open Secrets Browser, a program which uses the Open Secrets API to display information about federal legislators' top financial contributors. As a user, you can: - log in or create a new account - search for legislators by state - search for the financial information of a specific legislator - view that information as a chart using ChartJS - save that legislator to your 'favorites' - browse other users' 'favorites' - edit your user information, including your 'favorites' - delete your account
Getting Started
The frontend of this project was created using React, and styling was done using Semantic UI as well as CSS. The backend was built using Ruby on Rails (2.6.1). This project requires the use of an API key from Open Secrets, which can be acquired here. In this project, API calls are made from the front-end and are persisted…

Latest comments (0)