
Complete AWS-CDK implementation for Integrating Amazon Bedrock with MLflow on ECS Fargate
This step-by-step guide demonstrates how to build a generative AI observability platform based on MLflow tracking server. We will be deploying MLflow on Amazon ECS Fargate using AWS CDK (TypeScript) and integrate it with Amazon Bedrock in our scripts to track, monitor, and analyze LLM interactions.
Architecture Overview
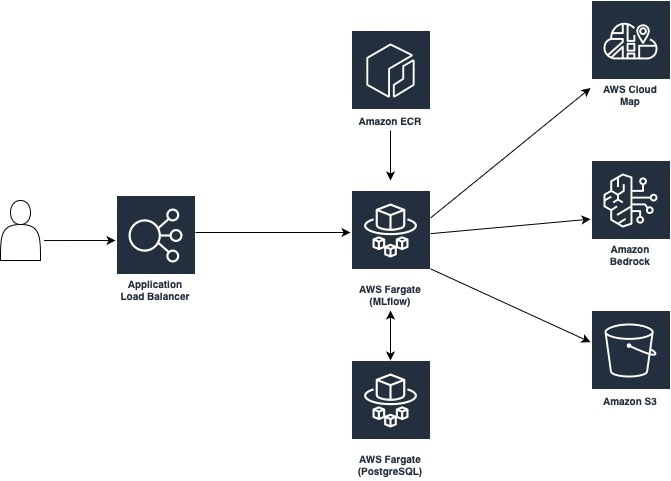
Our solution consists of the following components:
- MLflow Tracking Server: Deployed as a containerized application on Amazon ECS Fargate
- PostgreSQL Database: Lightweight, open-source database backend for MLflow metadata on Amazon ECS Fargate
- Amazon S3: Artifact store for MLflow experiments
- Amazon Bedrock: Fully managed foundation model service
- AWS Cloud Map: Service discovery for the MLflow and PostgreSQL containers, enabling seamless communication between components within the ECS cluster
- AWS CDK: Infrastructure as code using TypeScript
This architecture provides a scalable and cost-effective platform for tracking and analyzing your generative AI applications with MLflow’s powerful tracing capabilities.
Step-by-Step Implementation
Prerequisites
- AWS Account with appropriate permissions
- AWS CLI configured locally
- Node.js and npm installed
- AWS CDK Toolkit (
npm install -g aws-cdk) - Docker installed locally
- Basic knowledge of TypeScript and CDK
Clone the Repository
git clone https://github.com/awsdataarchitect/mlflow-bedrock-cdk.git
cd mlflow-bedrock-cdk
CDK Infrastructure Deployment
The core infrastructure is defined in lib/mlflow-bedrock-cdk-stack.ts:
cdk bootstrap
cdk deploy
Our CDK stack creates:
- A VPC with public and private subnets
- An ECS cluster to host our containers
- An S3 bucket for MLflow artifact storage
- A PostgreSQL database running in Fargate for MLflow backend
- A load-balanced MLflow service with public access
- Appropriate IAM roles and security groups
- AWS Cloud Map namespace for service discovery
- ECR repository for storing container images
- Fargate tasks for both MLflow and PostgreSQL services
- Application Load Balancer (ALB) for routing traffic to the MLflow service
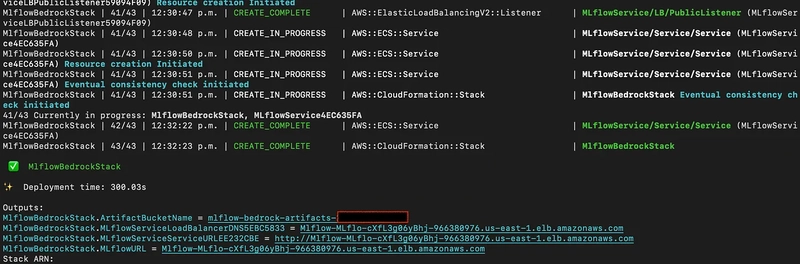
The deployment will take 5 - 6 minutes. Once completed, the CDK will output the URL for your MLflow tracking server.
Integrating Amazon Bedrock with MLflow
Now that we have our MLflow server running, let’s run our sample Python scripts to demonstrate the integration with Amazon Bedrock.
Basic Tracing Example (bedrock_tracing.py)
import boto3
import mlflow
import tiktoken
from mlflow.entities import SpanType

# Set your ALB tracking URI
mlflow.set_tracking_uri("http://Mlflow-MLflo-loG90qp0PACe-859729803.us-east-1.elb.amazonaws.com")

# Enable auto-tracing
mlflow.bedrock.autolog()

# Create experiment
mlflow.set_experiment("Bedrock-Token-Cost-Demo")

....

prompt = "Explain machine learning observability in one paragraph"

with mlflow.start_run():
    mlflow.log_param("prompt", prompt)

    # Fixed message structure
    response = bedrock.converse(
        modelId=model_id,
        messages=[{
            "role": "user",
            "content": [{
                "text": prompt  # Content must be list of content blocks
            }]
        }],
        inferenceConfig={
            "maxTokens": 512,
            "temperature": 0.1,
            "topP": 0.9
        }
    )
....
....
What this example script does:
-
MLflow Setup: Configures tracking, enables auto-tracing, and sets up an experiment (
Bedrock-Token-Cost-Demo). -
Bedrock Client: Initializes
boto3client foramazon.nova-lite-v1:0. - Token Cost Calculation: Computes token counts and cost using Amazon Nova Lite model pricing.
- Inference Execution: Sends prompt to Bedrock, retrieves and extracts response.
- MLflow Logging: Logs prompt, token metrics, and cost; prints response and total cost.
Example Output
python3 scripts/bedrock_tracing.py

2025/03/28 12:35:42 INFO mlflow.bedrock: Enabled auto-tracing for Bedrock. Note that MLflow can only trace boto3 service clients that are created after this call. If you have already created one, please recreate the client by calling `boto3.client`.
2025/03/28 12:35:44 INFO mlflow.tracking.fluent: Experiment with name 'Bedrock-Token-Cost-Demo' does not exist. Creating a new experiment.
Response: Machine learning observability refers to the ability to monitor, diagnose, and understand the behavior and performance of machine learning models in real-time and throughout their lifecycle. It involves collecting and analyzing various metrics, logs, and traces to gain insights into model performance, data quality, and operational health. Observability helps in identifying issues such as data drift, model drift, and performance degradation, enabling data scientists and engineers to make informed decisions, ensure model reliability, and maintain the overall health of machine learning systems. This practice is crucial for maintaining model accuracy, ensuring compliance, and facilitating continuous improvement in machine learning deployments.
Cost: $0.02934000
🏃 View run rambunctious-koi-880 at: http://Mlflow-MLflo-cXfL3g06yBhj-966380976.us-east-1.elb.amazonaws.com/#/experiments/1/runs/cabc0132b4164555bab2e6e7d0e5fb04
🧪 View experiment at: http://Mlflow-MLflo-cXfL3g06yBhj-966380976.us-east-1.elb.amazonaws.com/#/experiments/1
Advanced Features
Streaming Responses (bedrock_streaming.py):
MLflow’s Bedrock integration offers several advanced features like streaming and function calls (tool usage for Anthropic and Amazon Nova models that support tools). Let’s explore streaming responses with tracing.
import boto3
import mlflow

# Set tracking URI to your deployed MLflow server
mlflow.set_tracking_uri("http://Mlflow-MLflo-cXfL3g06yBhj-966380976.us-east-1.elb.amazonaws.com")  # Replace with your actual URL

# Enable auto-tracing for Amazon Bedrock
mlflow.bedrock.autolog()
mlflow.set_experiment("Bedrock-Streaming")

# Create a boto3 client for Bedrock
bedrock = boto3.client(
    service_name="bedrock-runtime",
    region_name="us-east-1",  # Replace with your region
)

# Call Bedrock streaming API
response = bedrock.converse_stream(
    modelId = "amazon.nova-lite-v1:0", # Or any Bedrock model you are using
    messages=[
        {
            "role": "user",
            "content": [
                {"text": "Write a short poem about machine learning observability."}
            ]
        }
    ],
    inferenceConfig={
        "maxTokens": 300,
        "temperature": 0.1,
        "topP": 0.9,
    }
)

# Process streaming response
for chunk in response["stream"]:
    if "message" in chunk:
        message_content = chunk["message"]["content"]
        if message_content:
            print(message_content[0]["text"], end="", flush=True)
MLflow captures streaming responses by creating a span when the streaming chunks are consumed, combining them into a single trace that can be viewed in the MLflow UI
python3 scripts/bedrock_streaming.py
2025/03/28 12:43:57 INFO mlflow.bedrock: Enabled auto-tracing for Bedrock. Note that MLflow can only trace boto3 service clients that are created after this call. If you have already created one, please recreate the client by calling `boto3.client`.
2025/03/28 12:43:58 INFO mlflow.tracking.fluent: Experiment with name 'Bedrock-Streaming' does not exist. Creating a new experiment.
Observability in MLflow UI
Exploring Traces in the MLflow UI
After running these examples, you can navigate to your MLflow server URL (AWS Application Load Balancer) to explore the captured traces:
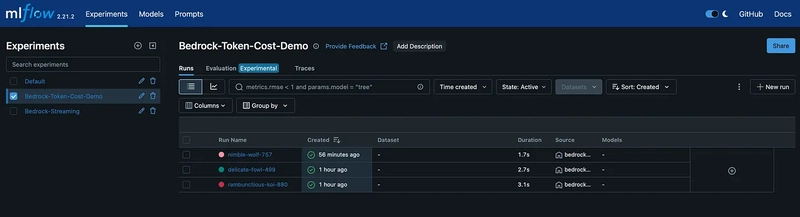
- In the MLflow UI, browse to the experiments you created
- Click on an experiment to see individual runs
- Each run represents a single interaction with Bedrock
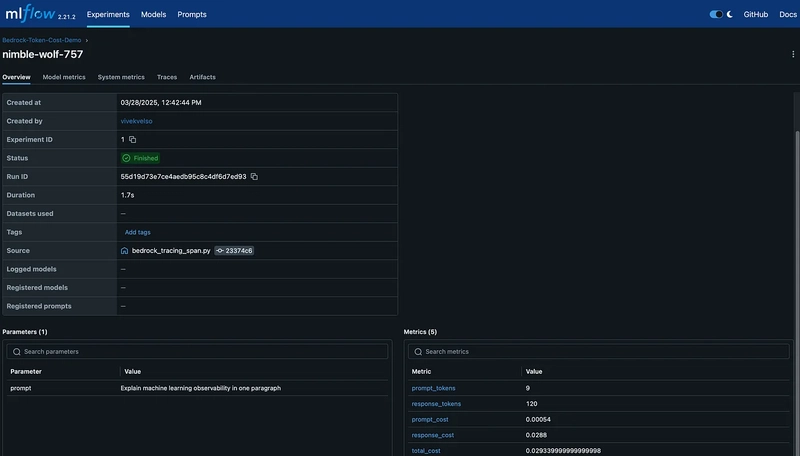
- Click on a run to view detailed information:
- The prompt and completion
- Model parameters (temperature, max_tokens, etc.)
- Latency information
- Streaming events (if applicable)
- Function calls (if applicable)
The MLflow UI provides a comprehensive view of your model interactions, making it easy to track and compare different prompts and responses.
MLflow UI
MLflow Run Experiment
Model Metrics
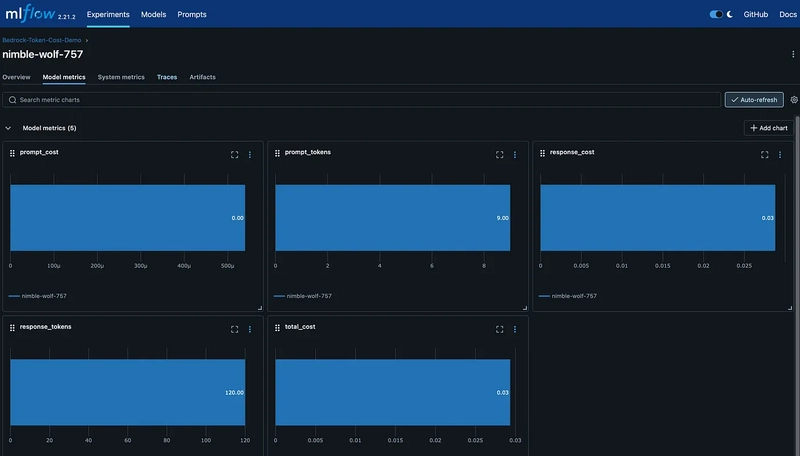
MLflow Traces
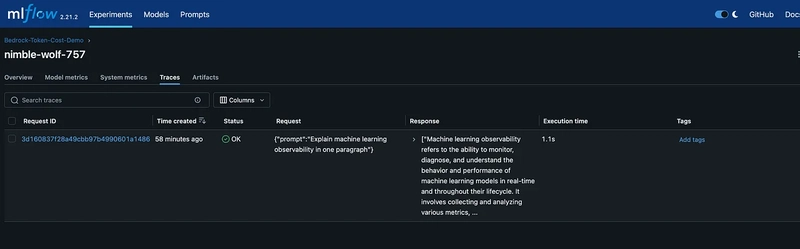
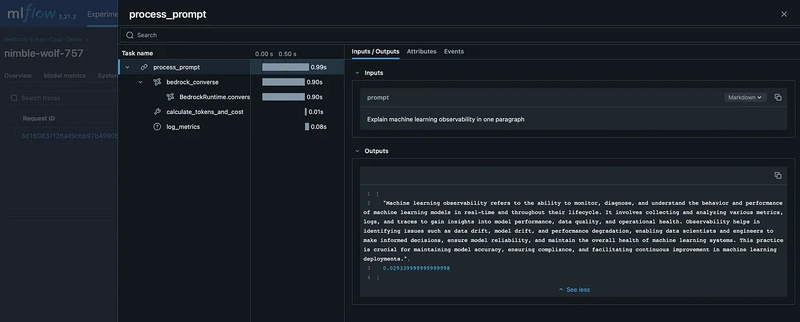
Trace details
Production Considerations
For production deployments, consider these enhancements:
Auto Scaling
Add the following to your CDK stack to enable auto-scaling for your MLflow service:
const scalableTarget = mlflowService.service.autoScaleTaskCount({
  minCapacity: 1,
  maxCapacity: 5
});
scalableTarget.scaleOnCpuUtilization('CpuScaling', {
  targetUtilizationPercent: 70,
  scaleInCooldown: cdk.Duration.seconds(60),
  scaleOutCooldown: cdk.Duration.seconds(60)
});
Security Enhancements
Use AWS Secrets Manager for PostgreSQL credentials:
const dbCredentials = new secretsmanager.Secret(this, 'PostgresCredentials', {
  secretName: `${projectName}-db-credentials`,
  generateSecretString: {
    secretStringTemplate: JSON.stringify({ username: 'mlflow' }),
    generateStringKey: 'password',
    excludePunctuation: true
  }
});

// Reference in container definition
const postgresContainer = postgresTaskDefinition.addContainer('PostgresContainer', {
  // ...
  secrets: {
    'POSTGRES_USER': ecs.Secret.fromSecretsManager(dbCredentials, 'username'),
    'POSTGRES_PASSWORD': ecs.Secret.fromSecretsManager(dbCredentials, 'password')
  }
});
Restrict access to your MLflow server:
// In your MLflow service definition
const mlflowService = new ApplicationLoadBalancedFargateService(this, 'MLflowService', {
  // ...
  publicLoadBalancer: true
});

// Add ingress rule to only allow specific IP ranges
const lb = mlflowService.loadBalancer;
const lbsg = lb.connections.securityGroups[0];
lbsg.addIngressRule(
  ec2.Peer.ipv4('192.0.2.0/24'), // Replace with your IP range
  ec2.Port.tcp(80),
  'Allow access from corporate network only'
);
Troubleshooting Guide
Common issues and solutions:
MLflow Can’t Connect to PostgreSQL
If MLflow can’t connect to the PostgreSQL database:
- Check that security groups allow traffic on port 5432
- Verify that service discovery is properly configured
- Check if the PostgreSQL container is running
Bedrock API Permissions
If you encounter permission issues when calling Bedrock:
- Verify that your IAM role has the necessary Bedrock permissions
- Check if you’re trying to use a model that’s not enabled in your account
- Make sure the region in your Bedrock client matches the region where the model is available
MLflow UI Not Loading Traces
If traces don’t appear in the MLflow UI:
- Verify that
mlflow.bedrock.autolog()is called before making Bedrock API calls - Check if the tracking URI is set correctly
- Look for any exceptions in your Python script
Cleanup
To delete all AWS resources provisioned via CDK, run:
cdk destroy
This ensures that no unnecessary infrastructure is left running and helps avoid additional costs.
Conclusion
In this guide, we have implemented an MLflow-powered observability framework for generative AI, seamlessly integrated with Amazon Bedrock for model interaction tracking, cost analysis, and token usage monitoring. By deploying MLflow on ECS with a lightweight PostgreSQL backend, we’ve created a cost-effective solution for tracking and analyzing LLM interactions.
By using CDK, we’ve made the infrastructure deployment repeatable and maintainable, allowing you to easily version and update your observability platform as your needs evolve.

Top comments (0)