In the previous article, we successfully containerized the LAMP stack application and conducted health checks on the containers. In this article, we will focus effectively monitoring these containers.
Container Monitoring is essential for maintaining the stability and efficiency of containerized applications. Monitoring containers allows you to gain insights into the resource usage, performance, and health of individual containers running within pods. It helps you identify potential issues with specific containers, track resource consumption, and troubleshoot application problems at a granular level.
To effectively monitor the containers, we will utilize tools like cAdvisor, Prometheus, MySQLd Exporter, and Grafana. We will look into them individually as we progress.
Environment Setup
For the setup, we could install them directly on the host OS. However, given that the article is container-focused, we will deploy them within containers. This approach simplifies the process and cleanup after the tasks have been completed.
Architecture Diagram
This is an overview of what the setup will look like and how each component communicates with the other:

Please check the below embed to view in higher resolution
Project Structure
The folder structure for this article will look like the below:
.
├── .env
├── docker-compose.yml
├── install.sh
├── mysql
│   ├── db.sql
│   └── makefile
├── monitoring
│   ├── alertmanager
│   │   └── alert.yml
│   ├── docker-compose.yml
│   ├── grafana
│   │   └── grafana_db
│   ├── prometheus
│   │   ├── prometheus.yml
│   │   └── rules.yml
│   ├── .env
│   └── .my.cnf
├── php
│   ├── .env
│   ├── Dockerfile
│   ├── form.html
│   ├── form_submit.php
│   └── makefile
├── setup.sh
└── vagrantfile
The only thing new here is the monitoring directory, we already created the rest directories and files in the previous article.
cAdvisor
cAdvisor (Container Advisor) is an open-source monitoring and performance analysis tool specifically designed for containerized environments. It provides real-time insights into container resource usage and performance characteristics on a host system by collecting metrics like CPU, memory, network stats, and file system use at regular intervals for monitoring and analysis.
Our objective here is to set up cAdvisor to monitor and extract metrics from the containers. Subsequently, Prometheus will be configured to scrape these metrics, enabling them to be collected and processed. Prometheus utilizes the metrics it scrapes from cAdvisor to enable comprehensive monitoring and management of the containers. These metrics are stored as time series data, forming the foundation for analysis, visualization, and querying.
- For cAdvisor to scrape metrics from containers, it needs access to the Docker data directory and Docker socket (which is essentially the Docker API) in order to effectively scrape metrics from containers and provide monitoring information. Since we will be running the containers with Docker compose, in our Docker Compose file, we will mount the relevant paths with container information inside the cAdvisor container.
If you choose not to use cAdvisor to collect metrics, you can use the Docker Daemon or Engine. If you're using Docker Desktop, go to your Docker Desktop settings, select "Docker Engine," and add the following configuration:
"metrics-addr" : "127.0.0.1:9323",
and change "experimental" from false to true. The final configuration should look like this:
{
  "builder": {
    "gc": {
      "defaultKeepStorage": "20GB",
      "enabled": true
    }
  },
  "experimental": true,
  "features": {
    "buildkit": true
  },
  "metrics-addr": "127.0.0.1:9323"
}
or like this
{
  "metrics-addr" : "127.0.0.1:9323",
  "builder": {
    "gc": {
      "defaultKeepStorage": "20GB",
      "enabled": true
    }
  },
  "experimental": true,
  "features": {
    "buildkit": true
  }
- Click on the
Apply & Restartbutton.
NB: If you have docker engine installed on your system, go to /etc/docker/docker-daemon directory and do the same thing.
With this, the Docker Engine exposes the metrics at http://localhost:9323 for Prometheus to scrape.
- To see the metrics from the Docker Daemon/Engine, visit
http://localhost:9323/metrics:

Prometheus
Prometheus is an open-source systems monitoring and alerting tool. In the context of cAdvisor, Prometheus scrapes (pulls) the metrics collected by cAdvisor from the Docker Daemon about containers and stores them in its database as time series data. This allows the metrics to be easily queried, analysed, and visualised for monitoring and understanding container behaviour.
- In the
monitoringdirectory, create aprometheusfolder and aprometheus.ymlfile inside it:
mkdir prometheus
cd prometheus
touch prometheus.yml
- Paste the below contents into the
prometheus.ymlfile: ```jsx
global:
scrape_interval: 5s
external_labels:
monitor: 'docker-container-monitor'
rule_files:
- rules.yml
alerting:
alertmanagers:
- static_configs:
- targets:
- alertmanager:9093
- targets:
scrape_configs:
-
job_name: 'prometheus'
static_configs:- targets: ['prometheus:9090']
-
job_name: 'cadvisor'
scrape_interval: 5s
static_configs:- targets: ['cadvisor:8080']
-
job_name: 'mysqld_exporter'
scrape_interval: 5s
static_configs:- targets: ['mysqld_exporter:9104']
-
job_name: 'node_exporter'
scrape_interval: 5s
static_configs:- targets: ['node-exporter:9100']
Let's break down what each section does:

- **`global:`** This section contains global configuration settings for Prometheus. The `scrape_interval` specifies the time interval at which Prometheus should scrape metrics (in this case, every 5 seconds). The `external_labels` section is used to add additional labels to all collected metrics. In this example, the label "monitor" with the value "docker-container-monitor" is added to all metrics.

- **`rule_files:`** This specifies the paths to one or more rule files. In this case, the file named "rules.yml" contains alerting rules that Prometheus will evaluate against the collected metrics. We will be looking at this soon.

- **`alerting:`** This section configures how Prometheus sends alerts. It specifies the target addresses of Alertmanager instances. We will also be looking at this soon.

- **`scrape_configs:`** This is the heart of the configuration, defining various jobs for scraping metrics. Each `job_name` corresponds to a specific type of metric source. Under each `job_name`, the `static_configs` section lists the targets (endpoints) from which Prometheus should scrape metrics.

- The first **`job_name`** is "prometheus," which targets the Prometheus instance itself. This self-monitoring capability ensures that Prometheus remains reliable and continues to provide accurate data for other monitoring and alerting tasks.

- The second **`job_name`** is "cadvisor," targeting `cAdvisor` for container-level metrics with a scrape interval of 5 seconds.

- The third **`job_name`** is "mysqld_exporter," targeting the MySQL Exporter for database-related metrics with a scrape interval of 5 seconds.

- The fourth **`job_name`** is "node_exporter," targeting the Node Exporter for host machine operating system and hardware-related metrics with a scrape interval of 5 seconds.

If you went the Docker Daemon path as shown previously rather than using cAdvisor, the below configuration will need to be added inside the `prometheus.yml` file so that Prometheus has the endpoint where it needs to scrape the metrics:
```jsx


  - job_name: docker
    scrape_interval: 5s
    metrics_path: /metrics
    static_configs:
      - targets: ['host.docker.internal:9323']
where;
job_name: docker:This is the name you're giving to the job. It's a label that helps you identify this particular job in Prometheus.scrape_interval: 5s:This specifies the interval at which Prometheus will scrape (collect) metrics from the specified target(s). In this case, it's set to 5 seconds.metrics_path: /metrics:This is the path at which Prometheus will request metrics from the target(s). In many applications and services, a common convention is to expose metrics at the "/metrics" endpoint.static_configs:This section defines a list of static targets that Prometheus will scrape. Each target is specified as a dictionary with its own configuration options.targets: ['host.docker.internal:9323']:This is the target you're configuring Prometheus to scrape metrics from. In this case, the target ishost.docker.internal(which is a special DNS name used to refer to the host machine from within Docker containers) and the port 9323.
Environment Variables
- In the
monitoringdirectory, create a.env filewhich will contain environment variables for the Grafana container:
touch .env
- Paste the below contents into the
. envfile: ```
GF_SECURITY_ADMIN_USER=
GF_SECURITY_ADMIN_PASSWORD=
When you run Grafana for the first time, the default username and password is `admin` but for security reasons, we need to override that and set our own username and password. Be sure to give and username and password in the above.

Now we will create a configuration file that the MySQLd Exporter will use in accessing the MySQL server.

- In the same monitoring directory, create a `.my.cnf` file:
```jsx


touch .my.cnf
- Paste the below into it: ```
[client]
user = root
password = Strongpassword@123
host = mysql
If you recall, we used these variables when creating the MySQL server container. If you changed your variables, ensure to replace the above configuration file with the appropriate ones.
## Alerting and Notification:
We will configure alerts to notify us in case of unusual behaviour or performance decline within the containers. Alerts can be established either through Prometheus or within Grafana. For now, our emphasis will be on configuring alerts in Prometheus.
Additionally, there are various methods to configure alerts, including email, Slack, Teams, etc. You can learn more about them [here](https://prometheus.io/docs/alerting/latest/configuration/).
For the scope of this article, we will configure alerting for Slack.
### Setup Slack Channel
To setup alerting for Slack, we will need a Slack channel in a workspace that we have admin access to. You can learn how to create a new Slack workspace [here](https://slack.com/help/articles/206845317-Create-a-Slack-workspace).
If you already have a workspace, you can proceed to creating a new channel in the workspace.
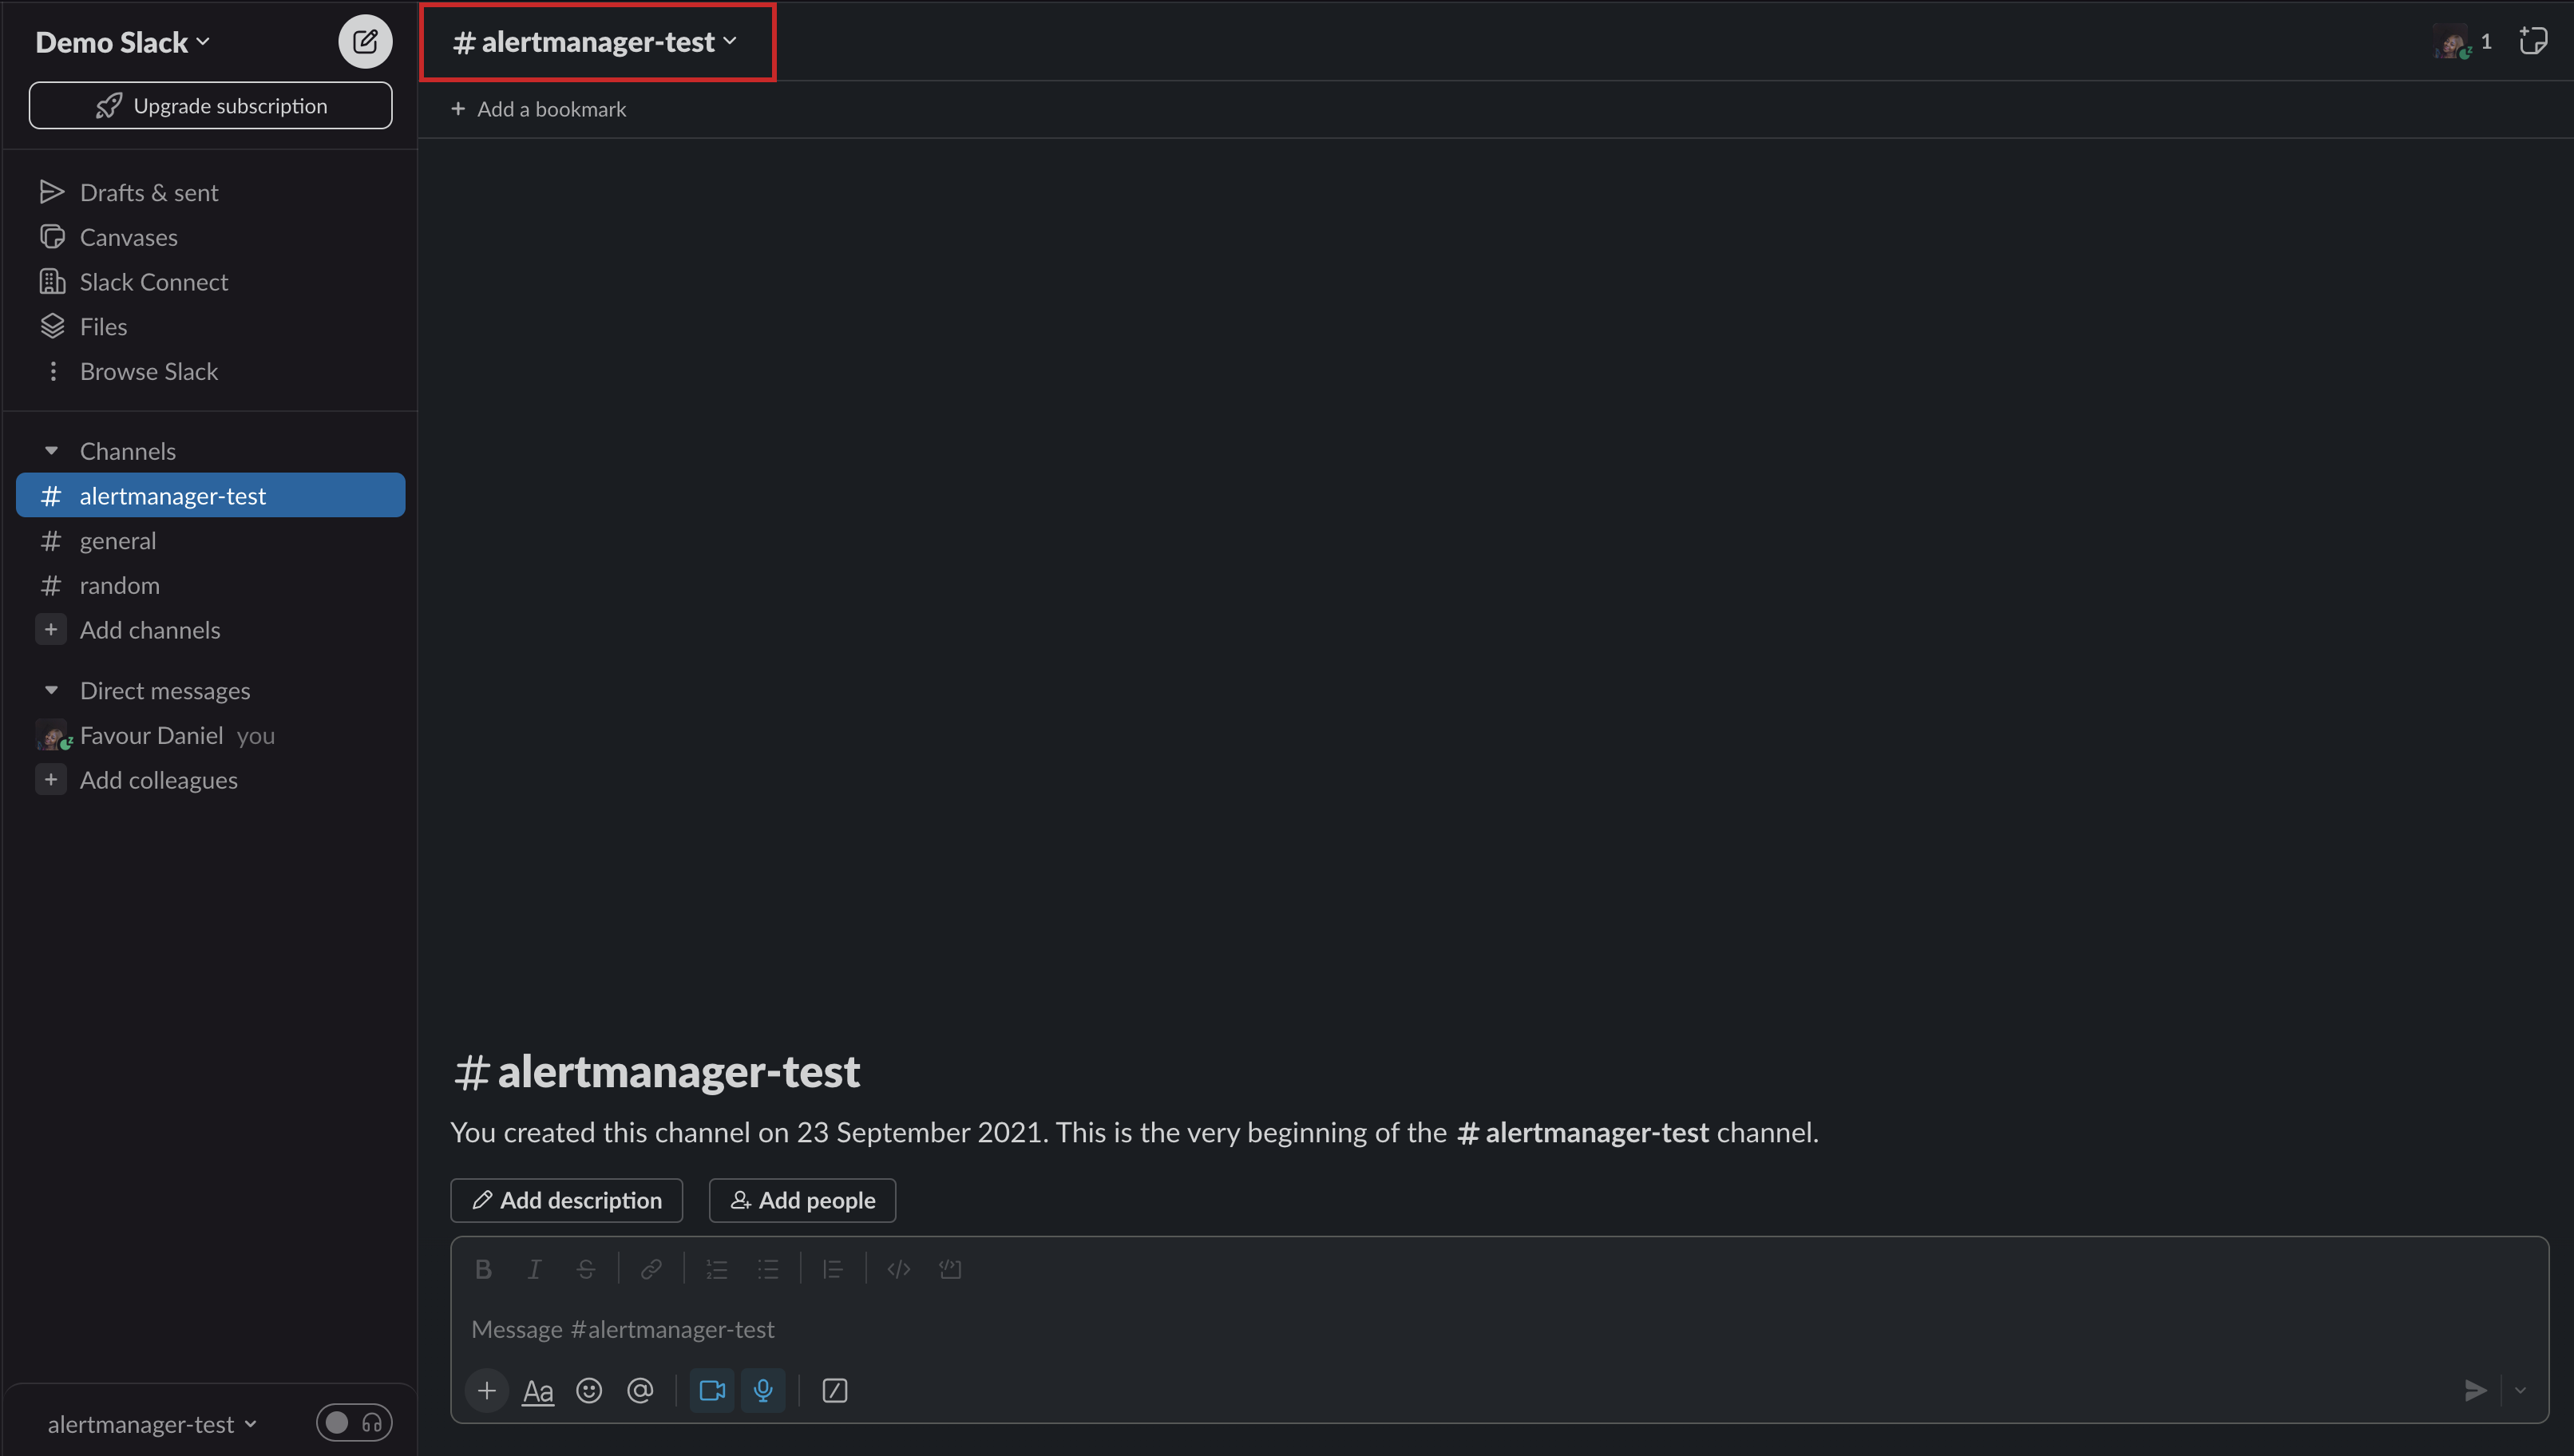
- Create a channel in the workspace and give it a name like `alertmanager` or any name of your choice. Click on the channel name at the top.
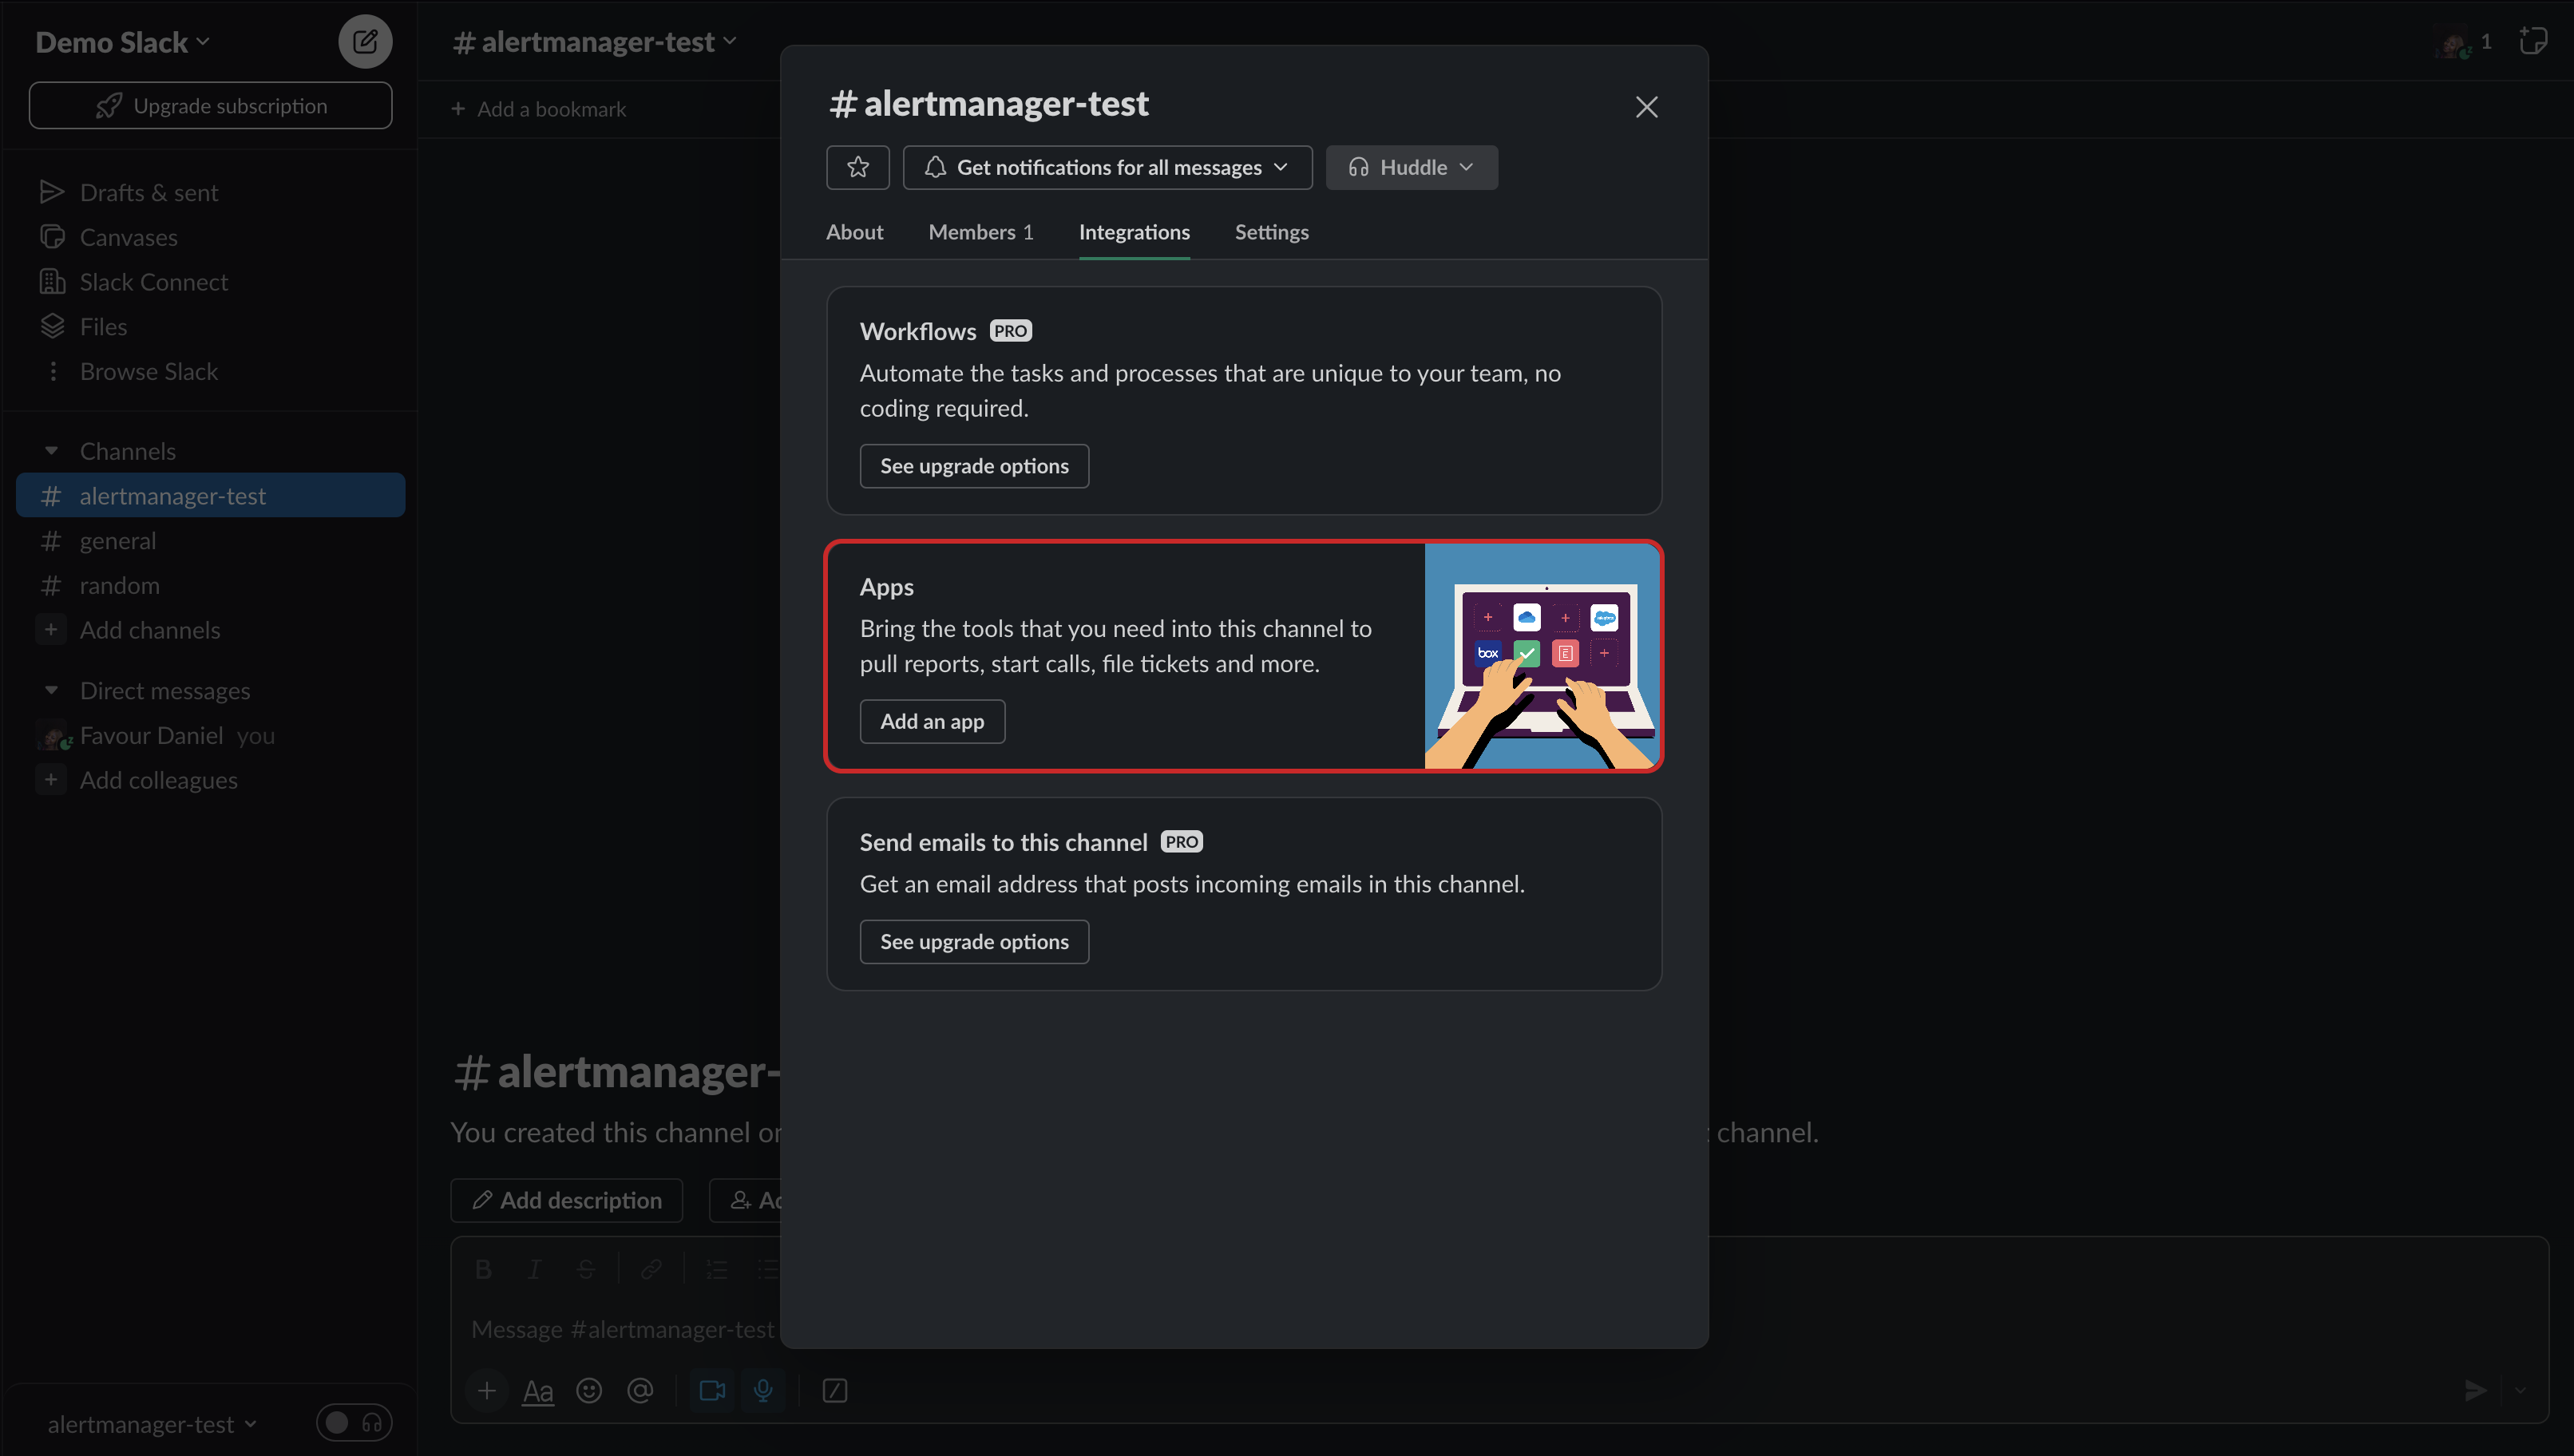
- You will be presented with the below screen. Select `Integrations` and under Apps, click on the `Add an App` button.
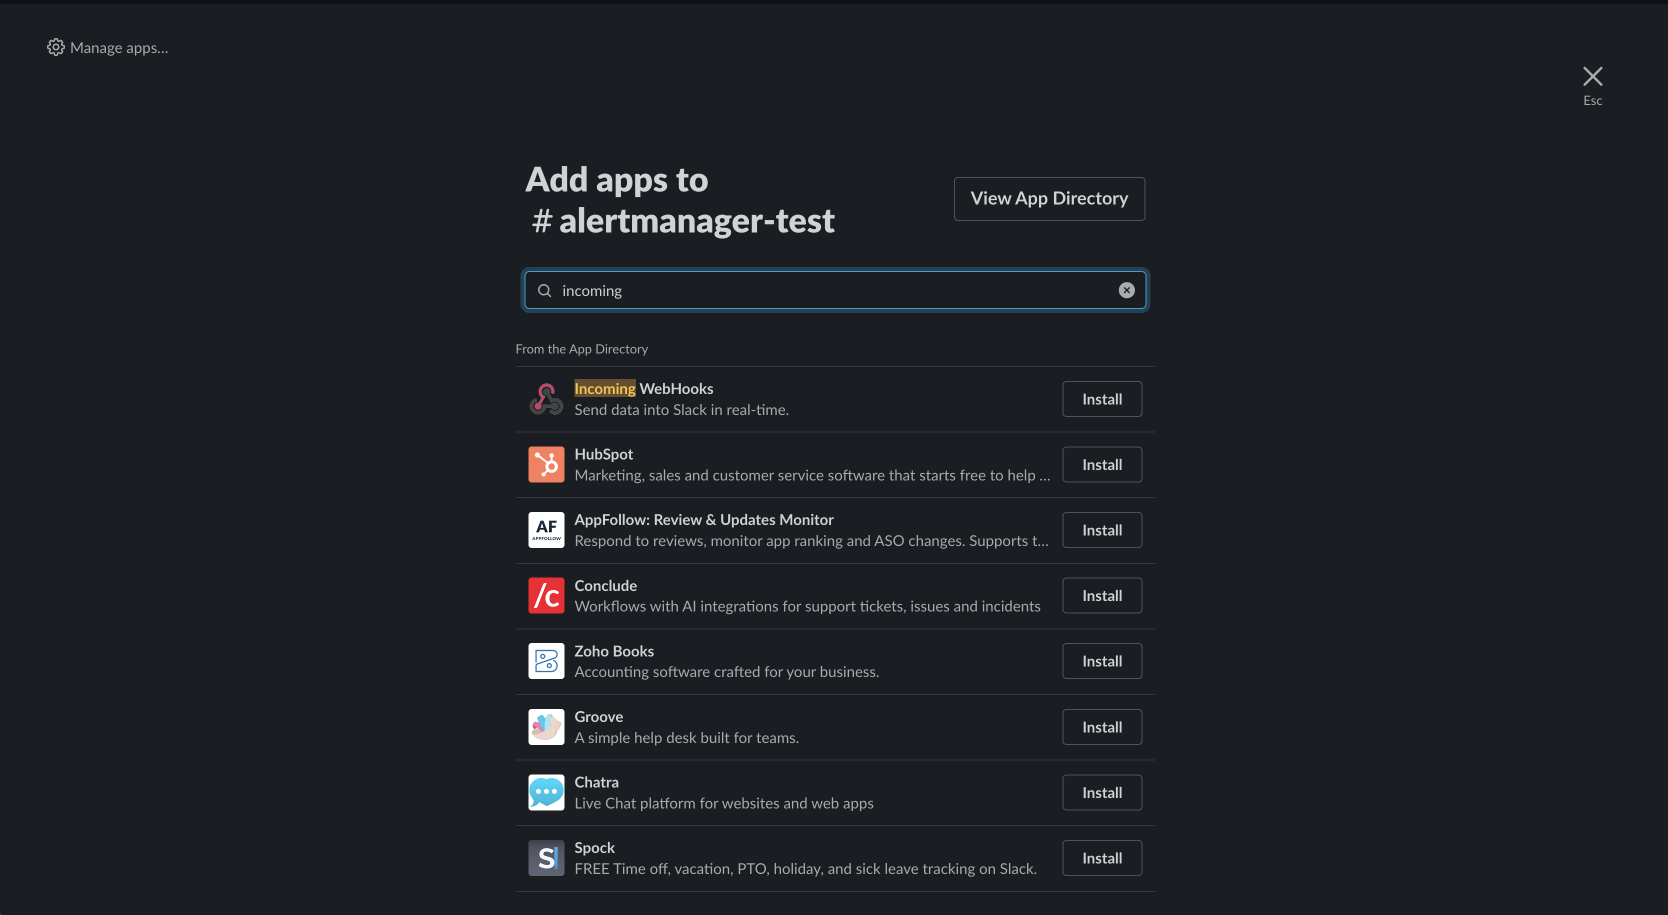
- Search for `Incoming Webhooks` and click the `install` button.
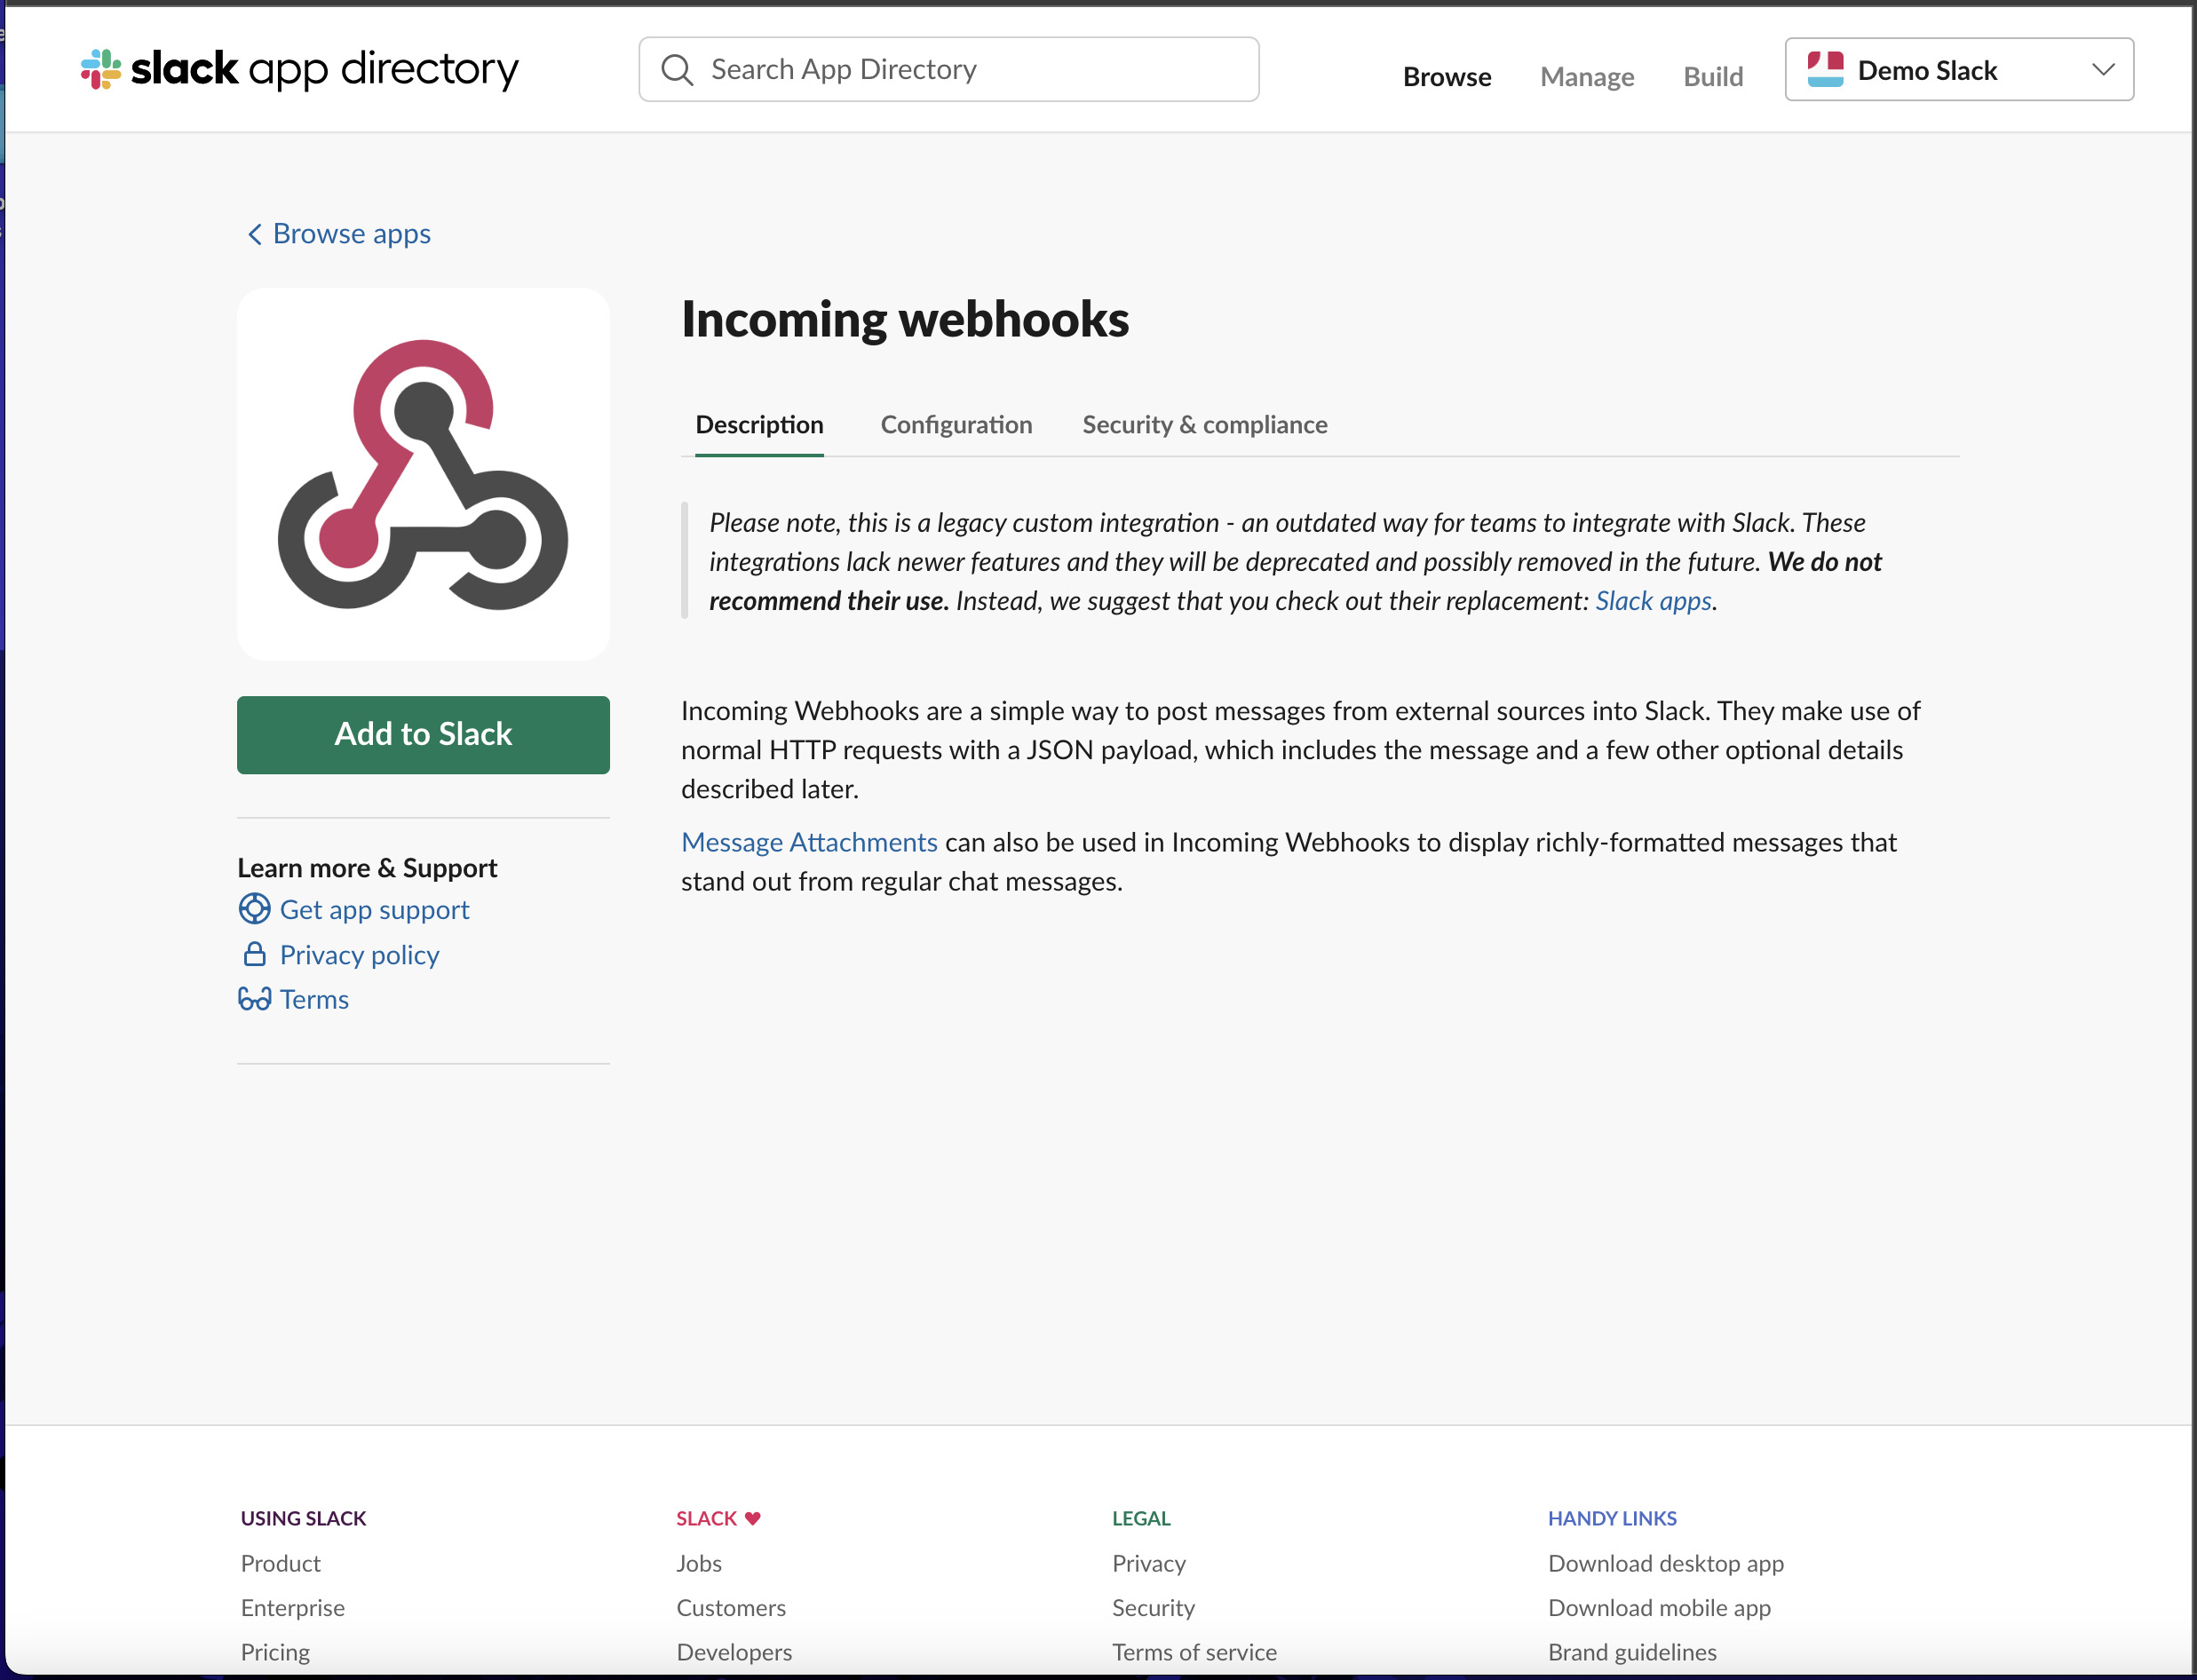
- You will be redirected to your browser, click the `Add to Slack` button.
- Search for the channel you want the Incoming Webhook app to be added to and select it.
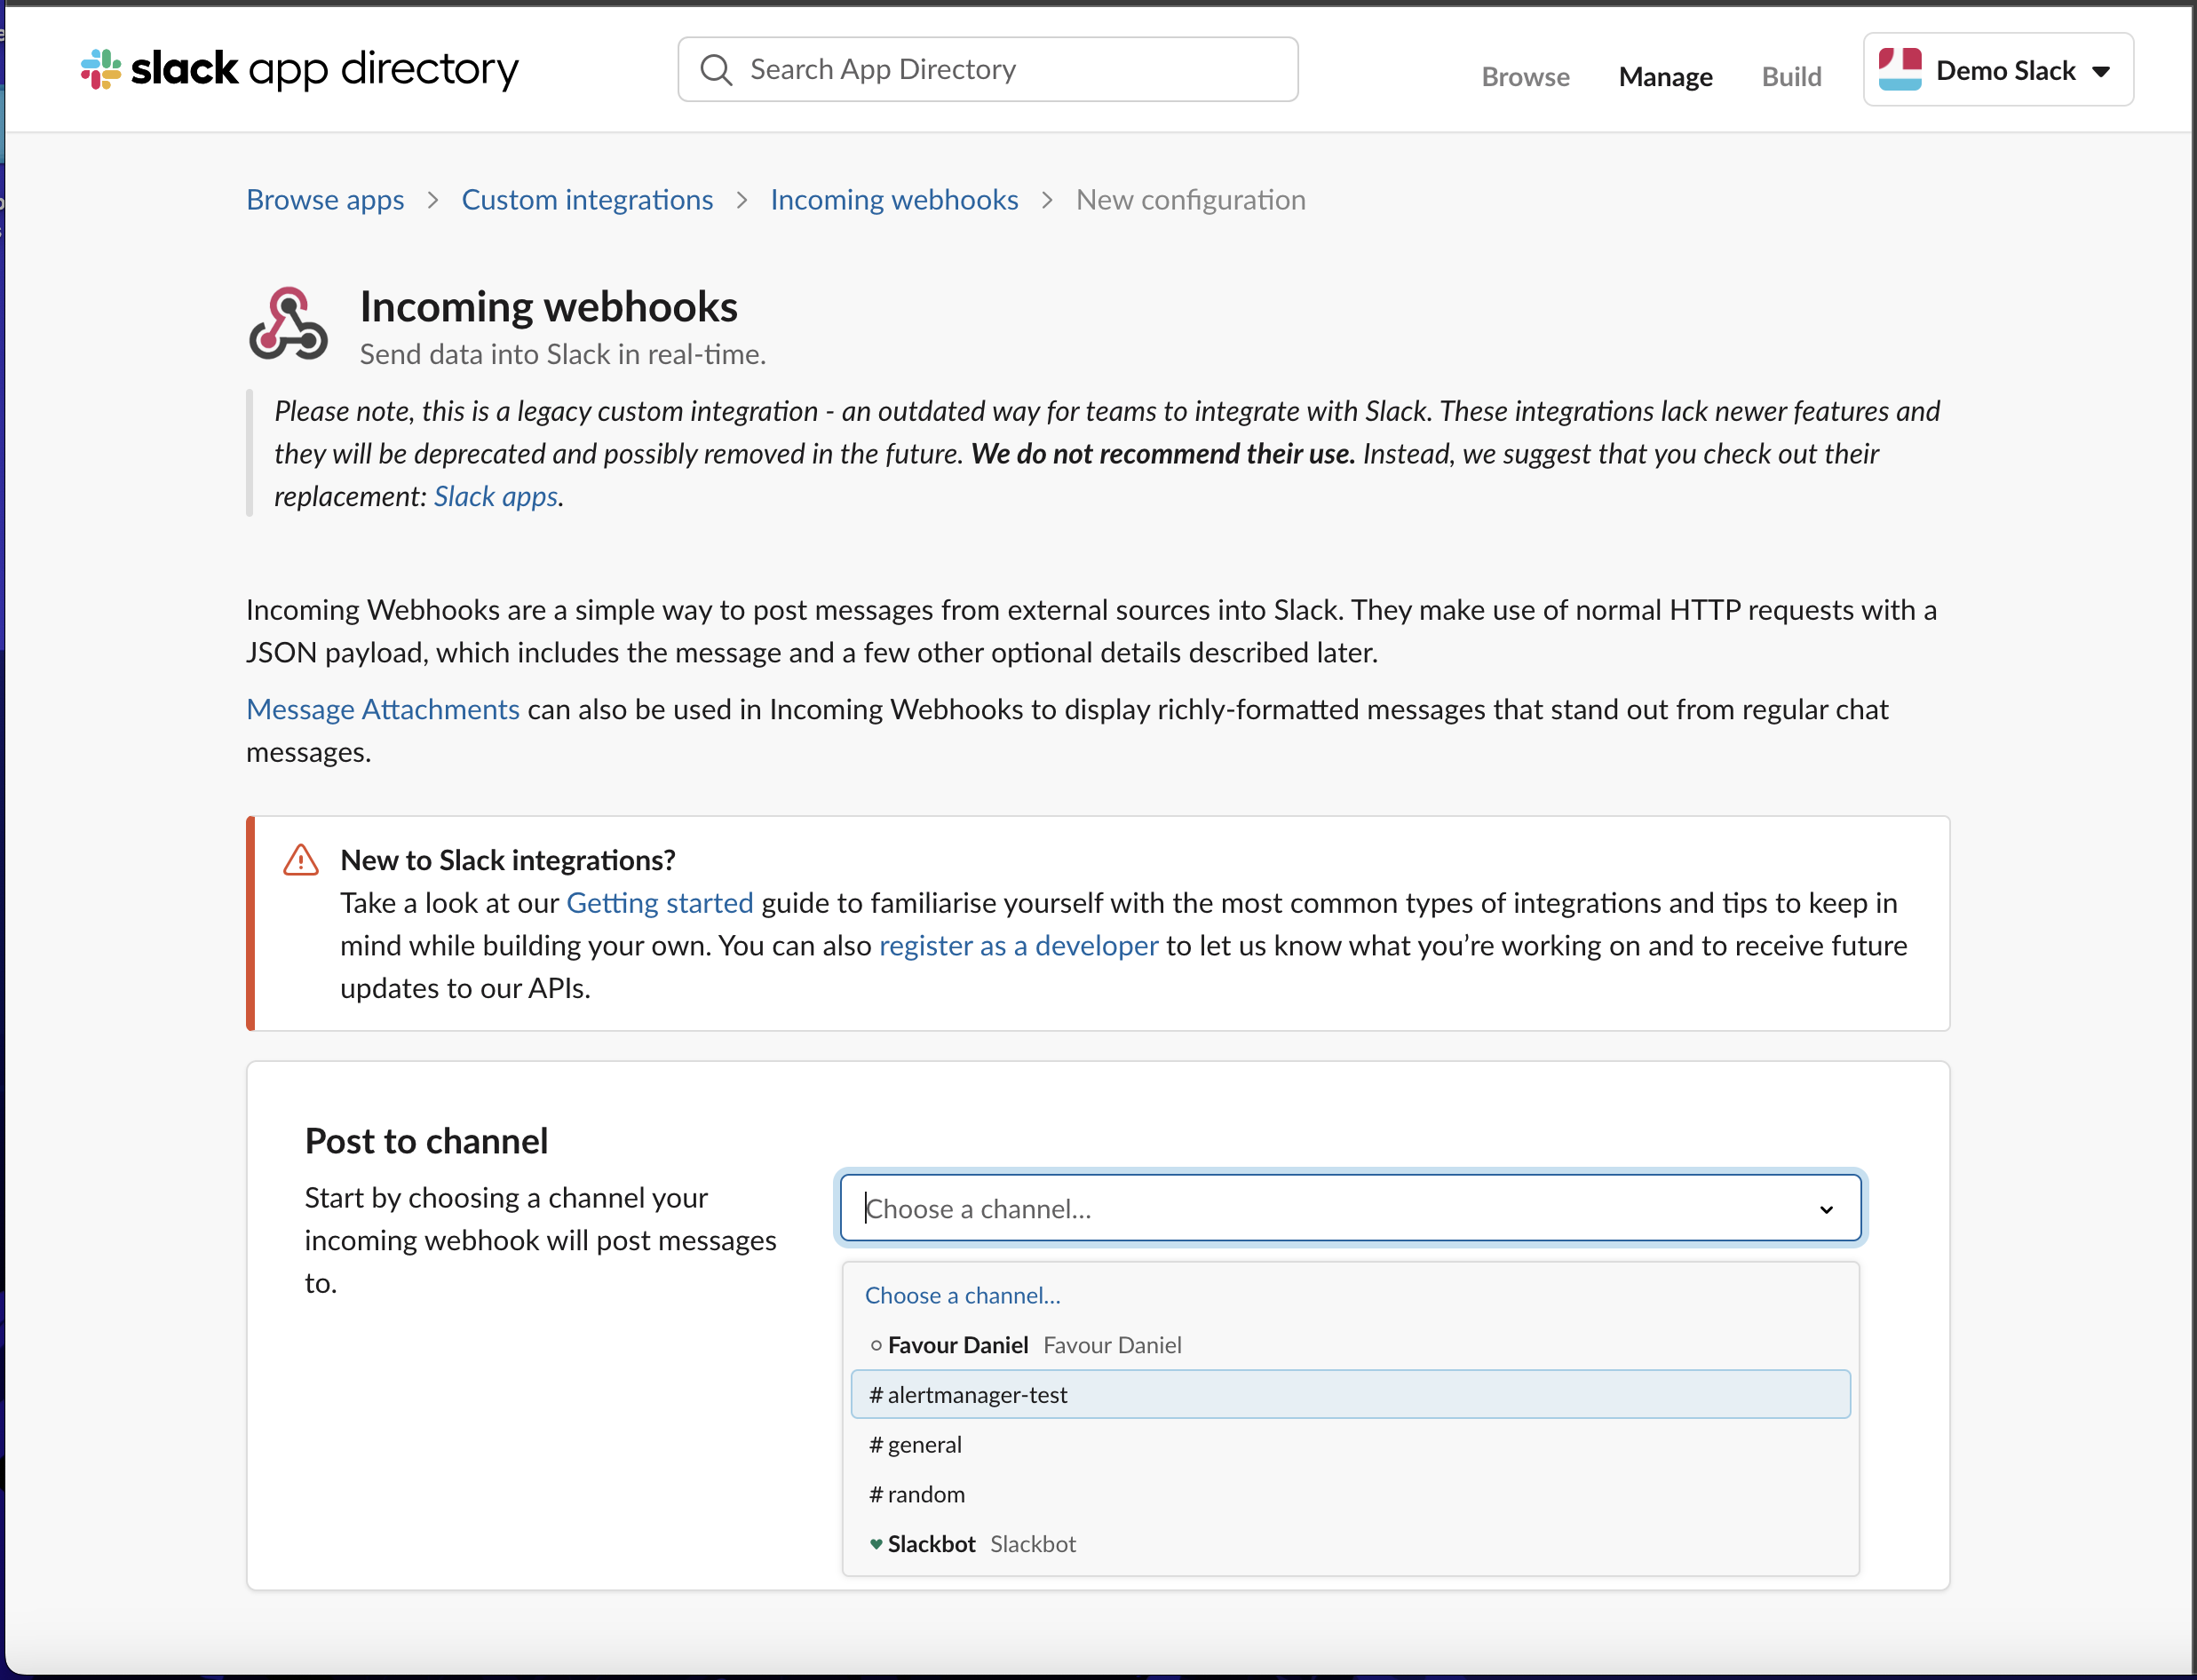
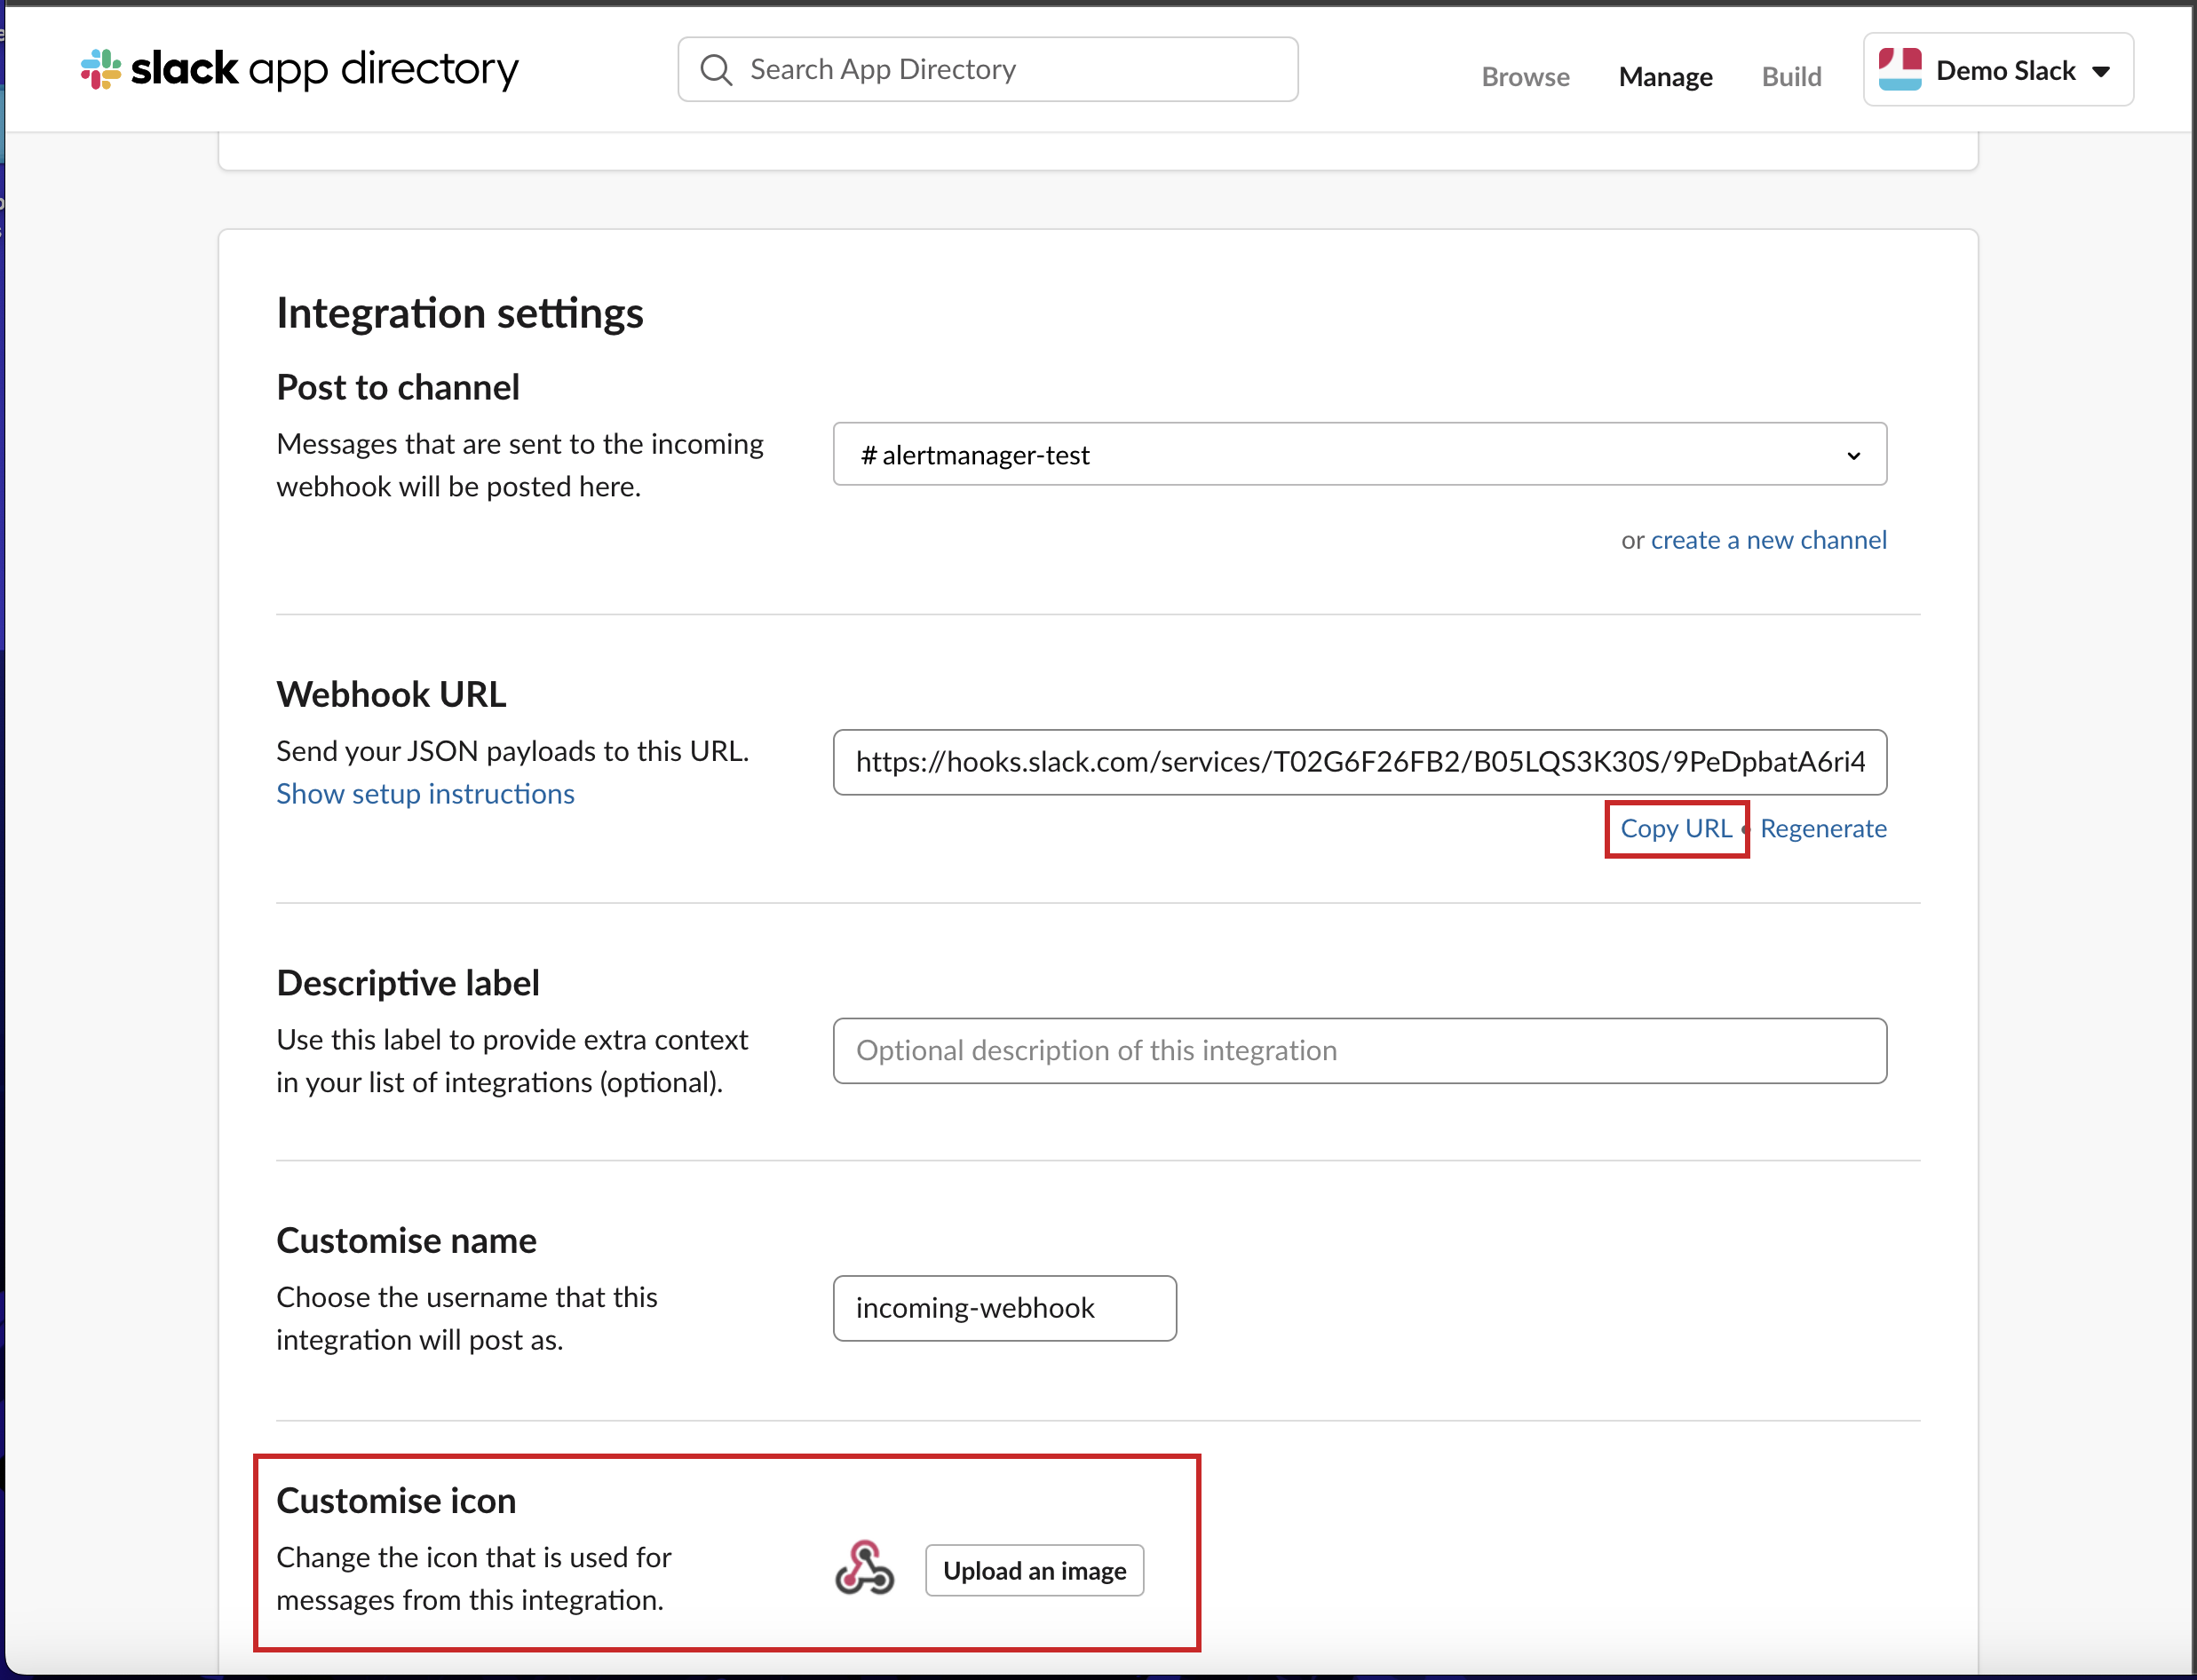
- You will be presented with the settings for it, scroll to the bottom and click the `Save Settings` button.
- Scroll down again and copy the Webhook URL already generated for you, you can also choose to customize the icon for it.
- Return back to Slack and you should see a message showing that an integration has been added to the channel.
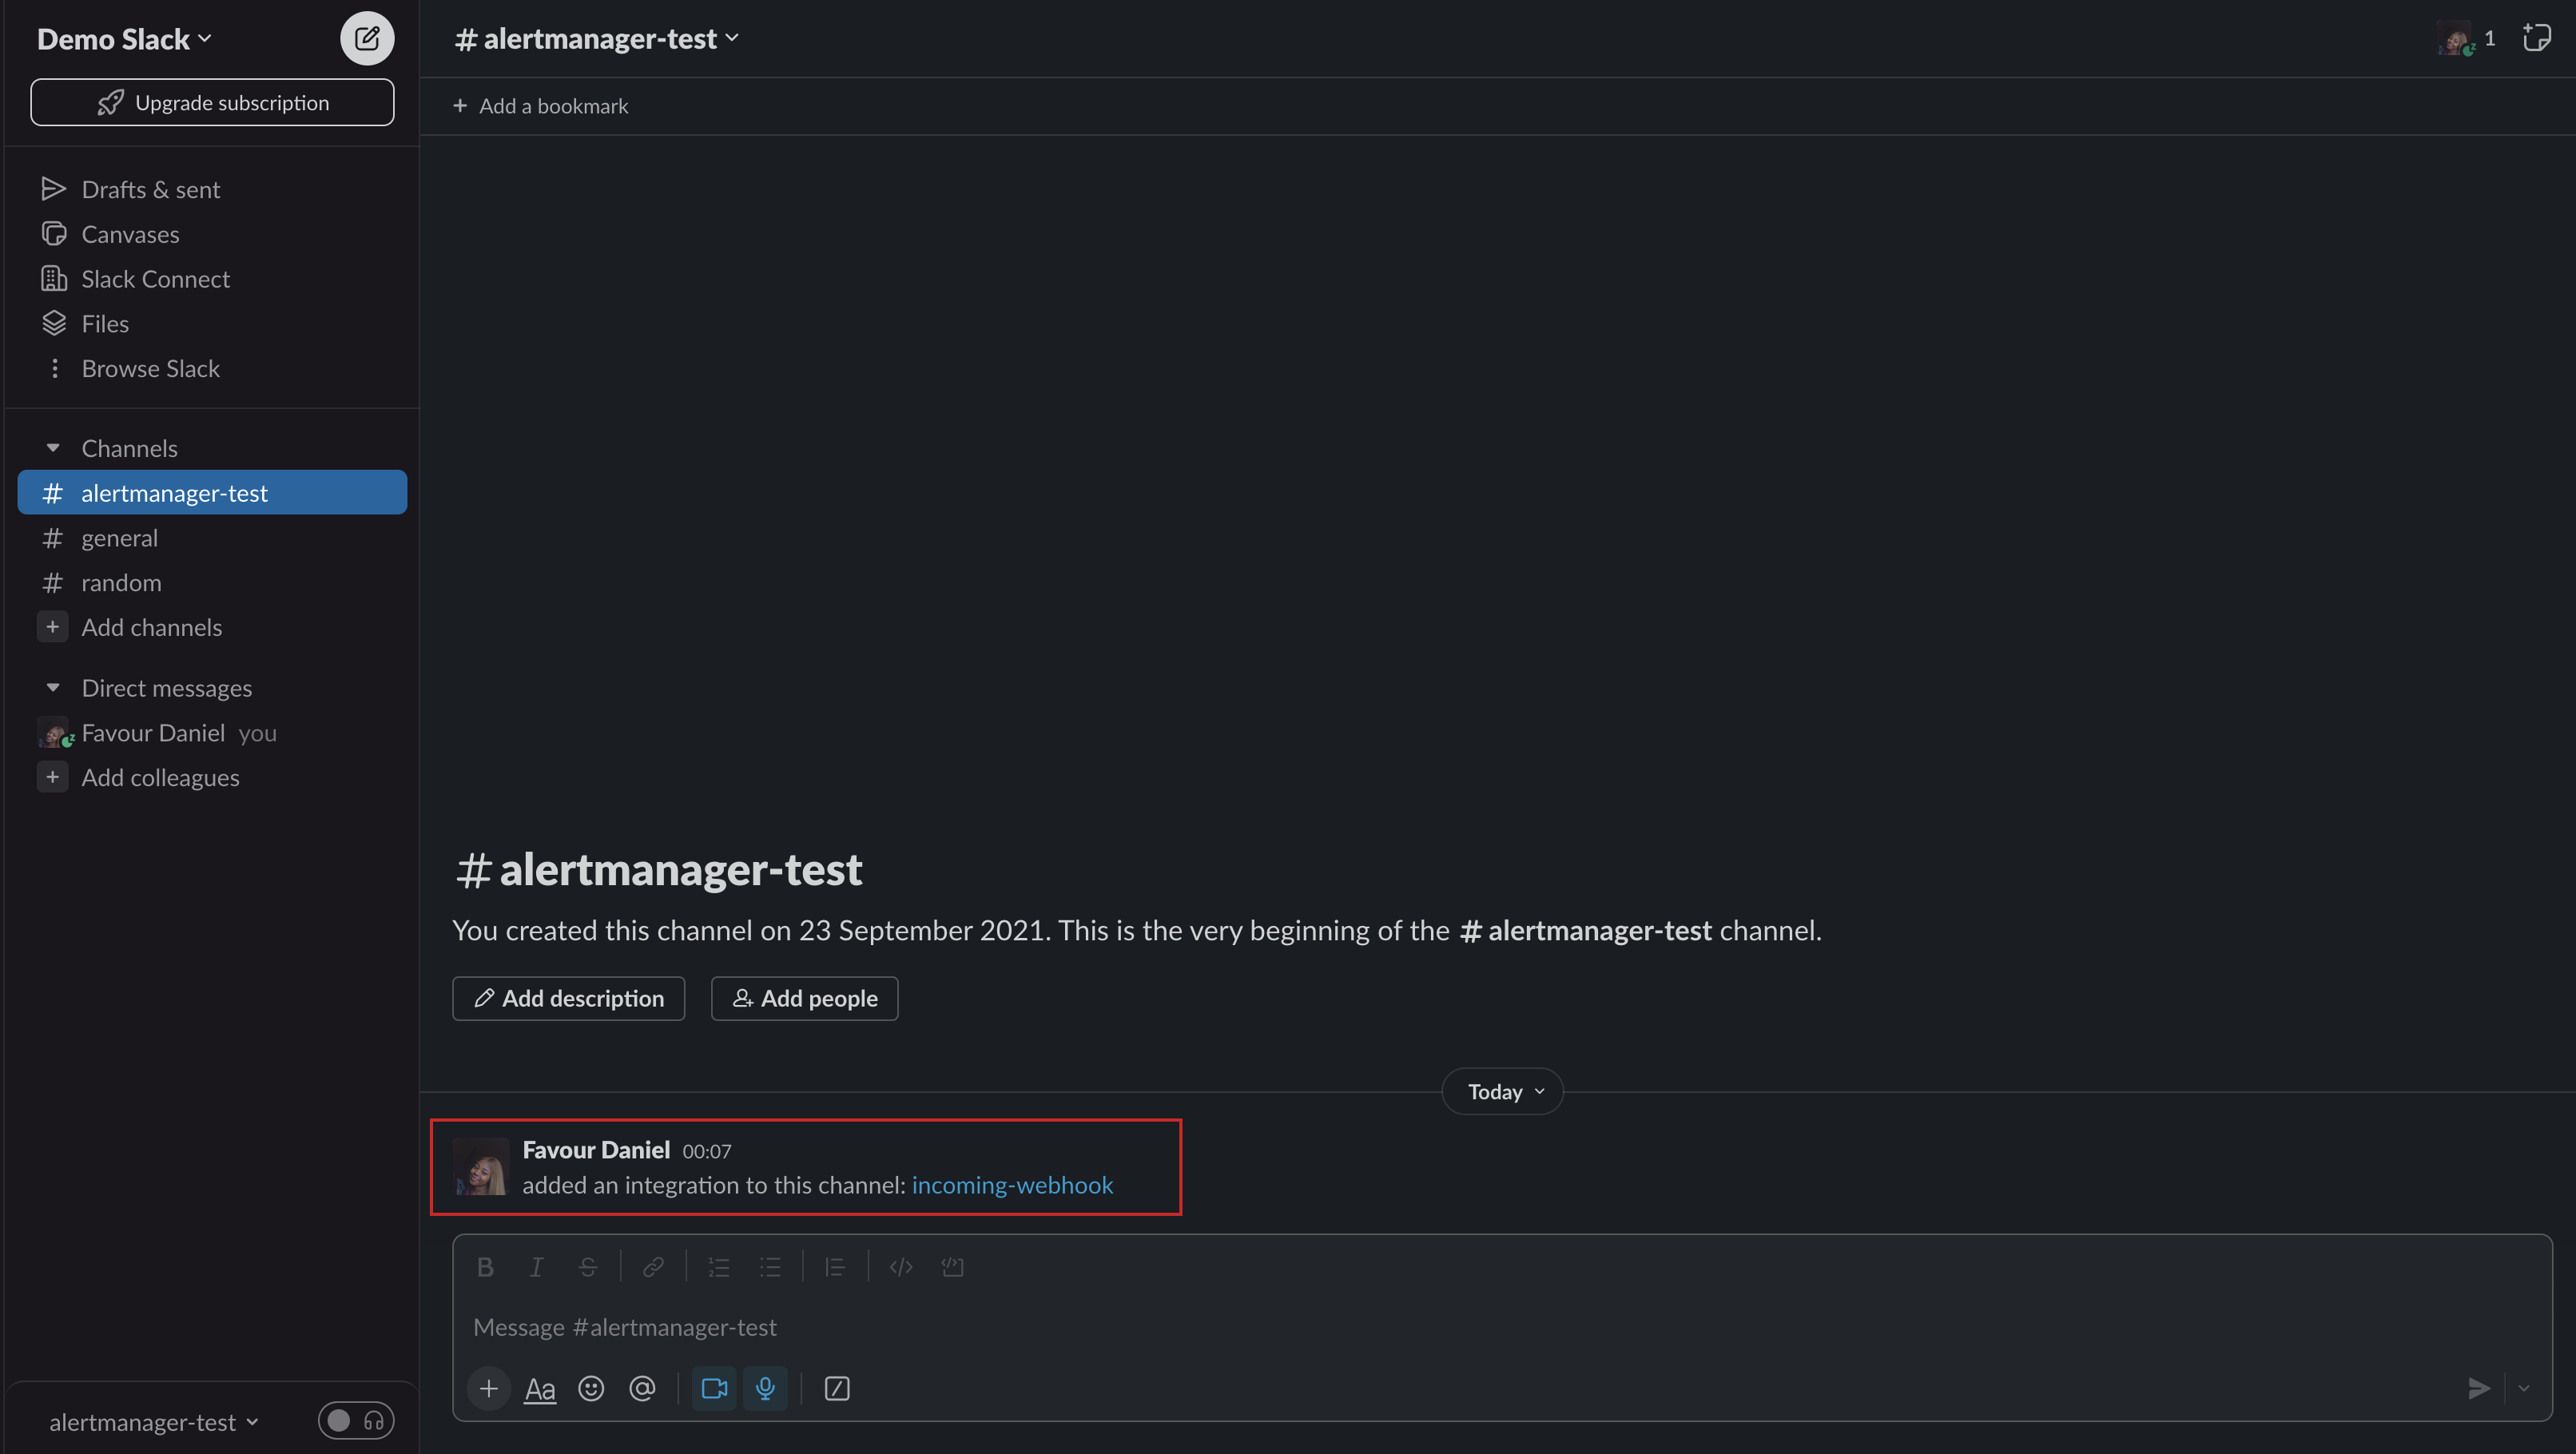
Now, the Slack channel has been prepped to receive alerts.
### Alertmanager
In production environments, downtimes occur frequently or less, and ensuring that you know about it before users do is important, hence why we will be setting up alerting for our containers using Alertmanager.
[Alertmanager](https://prometheus.io/docs/alerting/latest/alertmanager/) is an open-source component that works in conjunction with Prometheus for managing and sending alerts in a more sophisticated and organized manner. It is responsible for handling alerts generated by Prometheus and other sources, routing them to appropriate receivers, and deduplicating or grouping them as needed. It ensures that alerts are delivered reliably to the right individuals or systems for timely response.
We will be configuring Alertmanager to send alerts generated by Prometheus to the Slack channel we just created.
- Inside the monitoring directory, create a folder called `alertmanager` and create file called `alertmanager.yml` inside it:
```jsx
mkdir alertmanager
cd alertmanger
touch alertmanager.yml
- Paste the below configuration into the
alertmanager.ymlfile:
route:
  group_by: [cluster]
  receiver: alert-test
  group_interval: 30s
  repeat_interval: 30s
  routes:
    - match:
        severity: slack
        receiver: alert-test

receivers:
- name: alert-test
  slack_configs:
  - api_url: <insert the Webhook URL copied earlier>
    channel: '#alertmanager'
    icon_url: https://avatars3.githubusercontent.com/u/3380462
    send_resolved: true
    text: "<!channel> \nsummary: {{ .CommonAnnotations.summary }}\ndescription: {{ .CommonAnnotations.description }}"
Break down of the configuration:
Route Configuration:
-
group_by: [cluster]:This indicates that alerts should be grouped based on the "cluster" label. Alerts with the same cluster label value will be grouped together. -
receiver: alert-test:This specifies the default receiver for alerts. When an alert is triggered, it will be sent to the "alert-test" receiver. -
group_interval: 30s:This sets the interval for grouping alerts with the same label. In this case, alerts with the same cluster label value will be grouped every 30 seconds. -
repeat_interval: 30s:This sets the interval at which alerts are repeated. If an alert is still active, it will be sent again every 30 seconds. -
routes:This section defines routes based on specific conditions. -
match:This indicates that a route should be created when specific conditions are met. severity: slack: This specifies that the route applies to alerts with the "slack" severity label. -
receiver: alert-test:This route uses the "alert-test" receiver to send alerts matching the specified conditions.
Receiver Configuration:
-
name: alert-test:This defines the name of the receiver, which is used to identify it in the route and alerts. -
slack_configs:This section configures the Slack notification settings for this receiver. -
api_url:This is the Slack incoming webhook URL used to send notifications to Slack. Remember to paste the Webhook URL previously copied from the Webhook integration for thealertmanagerslack channel. -
channel:This specifies the Slack channel where notifications will be sent, which in this case is thealertmanagerchannel. -
icon_url:This URL points to an icon image for the Slack notification. -
send_resolved:true: This setting ensures that resolved alerts (alerts that return to a healthy state) are also sent as notifications. -
text:This is the content of the notification message. It uses template variables to include the alert's summary and description.
Return back to the Prometheus directory
- Create a
rules.ymlfile in thePrometheusdirectory and paste in the below configuration:
These rules define alerts that monitor the health and performance of containers and MySQL databases.
For the containers, the alerts include detecting when a Cadvisor container is down, when a container has been killed, is absent, experiences high memory usage, high throttle rate, low CPU utilization, or low memory usage.
For the the MySQL database, the alerts encompass scenarios where MySQL is down, there are too many connections (>80%), high threads running (>60%), slow queries, InnoDB log waits, or when MySQL has been restarted recently.
Docker Compose
For container orchestration, automation and simplicity, we will use a Docker Compose file to run all the containers.
- In the root of the project folder, create a new directory called
monitoringand in that directory create adocker compose file: ```jsx
mkdir monitoring
cd monitoring
touch docker-compose.yml
- Paste the below contents into the `docker-compose.yml` file:
Run the Containers
To run the containers defined in the Docker Compose file, run the below command from inside the monitoring directory:
docker compose up -d
</code></pre></div>
<p>This command automates the process of checking for the images specified in the file. If these images are already present on the system, the command proceeds to create and launch the corresponding containers. However, if the images are not available, it fetches them before initiating container creation. The command then ensures that these containers are executed in the background, freeing up the terminal for other tasks.</p>
<h2>
<a name="monitoring" href="#monitoring">
</a>
Monitoring
</h2>
<p>Now that the containers are up and running, we can monitor them and get insights.</p>
<h3>
<a name="alerts-in-slack" href="#alerts-in-slack">
</a>
Alerts in Slack
</h3>
<p>Immediately the containers are brought up with Docker Compose, you should receive an alert in your Slack channel.</p>
<p><img src="https://dev-to-uploads.s3.amazonaws.com/uploads/articles/4e8gmkch88lyqzwy3f9j.png" alt="Initial Alert"></p>
<p>The alert mentioned above originates from the MySQLd Exporter and serves to notify you when the MySQL server is either inactive or not functioning. In the previous article, we ran the MySQL container in conjunction with the PHP and phpMyAdmin containers. If the containers are still running, the alert won't trigger. In a situation that all three containers were stopped, the MySQLd Exporter identifies the absence of the MySQL container which runs the MySQL server and, noticing that it's non-operational, sends an alert.</p>
<p>The alert will continue to be sent at intervals to the channel until the issue has been resolved depending on the duration set. </p>
<p>If you take a close look at the rule alert</p>
<div class="highlight"><pre class="highlight jsx"><code>
<span class="o">-</span> <span class="nx">alert</span><span class="p">:</span> <span class="nx">ContainerKilled</span>
<span class="nx">expr</span><span class="p">:</span> <span class="dl">'</span><span class="s1">time() - container_last_seen > 60</span><span class="dl">'</span>
<span class="k">for</span><span class="p">:</span> <span class="mi">0</span><span class="nx">m</span>
<span class="nx">labels</span><span class="p">:</span>
<span class="nx">severity</span><span class="p">:</span> <span class="nx">warning</span>
<span class="nx">annotations</span><span class="p">:</span>
<span class="nx">summary</span><span class="p">:</span> <span class="nx">Container</span> <span class="nf">killed </span><span class="p">(</span><span class="nx">instance</span> <span class="p">{{</span> <span class="nx">$labels</span><span class="p">.</span><span class="nx">instance</span> <span class="p">}})</span>
<span class="nx">description</span><span class="p">:</span> <span class="dl">"</span><span class="s2">A container has disappeared</span><span class="se">\n</span><span class="s2"> VALUE = {{ $value }}</span><span class="se">\n</span><span class="s2"> LABELS = {{ $labels }}</span><span class="dl">"</span>
</code></pre></div>
<p>The <code>for: 0m</code> indicates that the alert condition is evaluated at the current moment (time()), and if it's true, the alert will be immediately fired. In other words, the alert doesn't require the condition to persist for a specific duration before being triggered; it will fire as soon as the condition is met.</p>
<p>In this specific case, the condition <code>time() - container_last_seen > 60</code> checks if the time elapsed since the last time the container was seen is greater than 60 seconds. If this condition becomes true at any given moment, the ContainerKilled alert will be fired immediately.</p>
<p>Now, when we bring the MySQL container back up, we will get an alert stating that the issue has been resolved:<br>
<img src="https://dev-to-uploads.s3.amazonaws.com/uploads/articles/5z2ojpxzi008uuzvyh73.png" alt="Resolved"></p>
<h3>
<a name="cadvisor" href="#cadvisor">
</a>
cAdvisor
</h3>
<ul>
<li>To access the cAdvisor container, visit <code>http:localhost:8080</code>:</li>
</ul>
<p><img src="https://dev-to-uploads.s3.amazonaws.com/uploads/articles/lobzsj0139xgxwl6yuei.png" alt="cadvisor"></p>
<ul>
<li>To see the metrics it is gathering about your containers from the Docker Daemon, click on <code>Docker Containers</code>:</li>
</ul>
<p><img src="https://dev-to-uploads.s3.amazonaws.com/uploads/articles/bmy6eku9xiw3d0eoylm2.png" alt="cadvisor docker container"></p>
<h3>
<a name="prometheus" href="#prometheus">
</a>
Prometheus
</h3>
<ul>
<li>To access the Prometheus GUI, visit <code>http://localhost:9090</code>:</li>
</ul>
<p><img src="https://dev-to-uploads.s3.amazonaws.com/uploads/articles/p4a2z7l9k36qg48j0zkq.png" alt="Prometheus"></p>
<ul>
<li>Click on <code>Status</code> as shown in the above image, and select <code>Targets</code> to see the endpoints or data sources that Prometheus is scraping (retrieving) metrics from:</li>
</ul>
<p><img src="https://dev-to-uploads.s3.amazonaws.com/uploads/articles/nyxqtvmb87a34552gy2c.png" alt="Targets"></p>
<p>This shows that all the endpoints are active and Prometheus can reach them</p>
<ul>
<li>To see the rules we defined in the Prometheus directly, click on <code>Status</code> again and select <code>Rules</code>:</li>
</ul>
<p><img src="https://dev-to-uploads.s3.amazonaws.com/uploads/articles/0u9ydi1p82wssh850oiu.png" alt="Rules"></p>
<p>All the rules defined are shown here.</p>
<ul>
<li>To see the Alerts, Click on <code>Alerts</code>:</li>
</ul>
<p><img src="https://dev-to-uploads.s3.amazonaws.com/uploads/articles/y3amhrglmceof8pyzvzt.png" alt="Alerts"></p>
<p>From the above we can see all the alerts from the <code>rules.yml</code> file we configured earlier. We can also see the "inactive," "pending," and "firing" status bars, which are used to describe the states of alerts and how they are managed within the alerting system.</p>
<ul>
<li><p><strong><code>Inactive:</code></strong> An alert is in the "inactive" state when the conditions specified in its alerting rule are not currently met. In other words, the metric or metrics being monitored have not crossed the defined threshold or condition to trigger the alert. Inactive alerts do not generate any notifications or actions.</p></li>
<li><p><strong><code>Pending:</code></strong> When an alert transitions from "inactive" to "firing," it goes through a "pending" state for a duration defined in the alerting rule. The "pending" state helps prevent alerts from rapidly toggling between "inactive" and "firing" due to minor fluctuations in metric values. During the "pending" state, no additional notifications are sent, and the alert is not escalated. If the condition persists for the defined duration, the alert transitions to the "firing" state.</p></li>
<li><p><strong><code>Firing:</code></strong> An alert is in the "firing" state when the conditions specified in its alerting rule are met and sustained over the duration of the "firing" state. This is the state where the actual alert notifications are generated and sent to configured receivers, such as email addresses or external services. The alert will remain in the "firing" state as long as the condition persists. Once the condition is resolved and the metric values no longer trigger the alert, it will transition back to the "inactive" state.</p></li>
</ul>
<p>From the above image, we have 17 alerts in a Pending state due to <code>ContainerLowCpuUtilization</code> and <code>ContainerLowMemoryUsage</code>.</p>
<p>If we look into the <code>ContainerLowCpuUtilization</code>, we can identify the containers with low CPU utilization:</p>
<p><img src="https://dev-to-uploads.s3.amazonaws.com/uploads/articles/hii11drp8wwav77wruzw.png" alt="low CPU utilization"></p>
<p>This above image reveals the container names exhibiting minimal CPU usage. The alert criteria was set to identify containers with CPU utilization below 20% over a span of one week. As the duration has not yet reached a full week, all containers are currently indicated as having CPU usage below the 20% threshold.</p>
<h3>
<a name="node-exporter" href="#node-exporter">
</a>
Node exporter
</h3>
<p>A Node Exporter is a utility used in conjunction with the Prometheus monitoring system to collect and expose metrics from an operating system's hardware and system resources. It allows you to monitor various aspects of the host machine's performance, resource utilization, and health.</p>
<p>To see host OS level metrics, access the node exporter at <code>http://localhost:9100</code> and Click on the <code>Metrics</code> link displayed:</p>
<p><img src="https://dev-to-uploads.s3.amazonaws.com/uploads/articles/ikznlff3iafqajjs5pel.png" alt="Node Exporter"></p>
<p><strong>NB:</strong> Our focus is not on the host OS metrics but on containers, we are only using the node exporter here to get better insights on monitoring and scraping with Prometheus.</p>
<h3>
<a name="alertmanager" href="#alertmanager">
</a>
Alertmanager
</h3>
<ul>
<li>The alert manager can be accessed at <code>http://localhost:9093</code>:</li>
</ul>
<p><img src="https://dev-to-uploads.s3.amazonaws.com/uploads/articles/3bfdvzkmssfucwx30mqq.png" alt="Alertmanager"></p>
<p>All alerts rules that moved from the <code>inactive</code> state to the <code>firing</code> state will appear here and the Alertmanager will send a alert to the Slack channel depending on the duration specified for that alert rule.</p>
<h3>
<a name="mysqld-exporter" href="#mysqld-exporter">
</a>
MySQLd Exporter
</h3>
<ul>
<li>The <a href="https://github.com/prometheus/mysqld_exporter">MySQL Exporter</a> is a tool used in conjunction with the Prometheus monitoring system to collect and expose metrics from MySQL database servers. It allows you to monitor various aspects of your MySQL database's performance and health, enabling you to detect potential issues, track trends, and set up alerts based on the collected metrics.</li>
</ul>
<p>The MySQLd Exporter can be accessed at <code>http://localhost:9104</code>:</p>
<p><img src="https://dev-to-uploads.s3.amazonaws.com/uploads/articles/qmp8djz23ep3vkknbey4.png" alt="MySQLd Exporter"></p>
<h2>
<a name="visualisation" href="#visualisation">
</a>
Visualisation
</h2>
<p>To gain deeper insights and enhance our container monitoring, we will be leveraging Grafana, a visualisation tool.</p>
<h3>
<a name="grafana" href="#grafana">
</a>
Grafana
</h3>
<p><a href="http://grafana.com/oss/grafana/">Grafana</a> is an open-source platform used for monitoring, visualisation, and analysis of time-series data. It enables users to create interactive and customisable dashboards that display metrics and data from various sources, making it easier to understand and interpret complex data trends and patterns. </p>
<p>We will be integrating the data and metrics generated from Prometheus into Grafana so that we can visualise it better.</p>
<p>The Grafana container has already been created and started, in your browser, visit <code>http:localhost:3000</code> to login to Grafana.</p>
<p><img src="https://dev-to-uploads.s3.amazonaws.com/uploads/articles/fpr500dw0rf9nwb2sjh1.png" alt="Grafana Login"></p>
<ul>
<li>Enter the admin user and password that was passed into the container as environment variables and you should be able to login.</li>
</ul>
<p><img src="https://dev-to-uploads.s3.amazonaws.com/uploads/articles/l82lmbdnz9iwl166nz9u.png" alt="Grafana Logged In"></p>
<ul>
<li>Click on "Add your first data source" and select "Prometheus"</li>
</ul>
<p><img src="https://dev-to-uploads.s3.amazonaws.com/uploads/articles/30bheoutop4loigyh5c8.png" alt="Add data source"></p>
<ul>
<li>Give it a name or you can stick with the default name, fill in the Prometheus URL which will be <code>http://prometheus:9090</code>. To be sure of the URL, you can check back the targets in Prometheus and the endpoint for Prometheus, that will be the URL to fill in</li>
</ul>
<p><img src="https://dev-to-uploads.s3.amazonaws.com/uploads/articles/si4rsrdoc44tpjez9kqf.png" alt="Prometheus"></p>
<ul>
<li>Scroll down to the bottom and click on the "Save and Test" button, you should get a successfully queries message, if not, check the URL again for mistakes.</li>
</ul>
<p><img src="https://dev-to-uploads.s3.amazonaws.com/uploads/articles/kd2262w3dcq09bkuha51.png" alt="Endpoint"></p>
<ul>
<li>Now go back to "Home" by clicking on the hamburger icon, then click on "Dashboards"</li>
</ul>
<p><img src="https://dev-to-uploads.s3.amazonaws.com/uploads/articles/jqds7w6ejuhfz8p7y01o.png" alt="Home"></p>
<ul>
<li><p>Click on the "New" button and select "Import"<br>
<img src="https://dev-to-uploads.s3.amazonaws.com/uploads/articles/nssfms497kdnjfnlnbxc.png" alt="Dashboard"></p></li>
<li><p>The first dashboard we will be importing will be for the MySQLd exporter, it's an open source dashboard which can you get more details about <a href="https://grafana.com/grafana/dashboards/14057-mysql/">here</a>. From the link, copy the ID number which is <code>14057</code> and paste into the <code>import</code> box and click on the <code>load</code> button:</p></li>
</ul>
<p><img src="https://dev-to-uploads.s3.amazonaws.com/uploads/articles/ek5ubydcy7958ze8y8is.png" alt="Import"></p>
<ul>
<li>The MySQLd dashboard will be loaded with metrics from the MySQL database for visualisation:</li>
</ul>
<p><img src="https://dev-to-uploads.s3.amazonaws.com/uploads/articles/orgs4itvnw7gik6d7gzi.png" alt="dashboard"></p>
<ul>
<li>Because the containers haven't been up for way too long, you might not see a lot of metrics displayed. We will can change the time range to <code>2m</code> to see all that has happened under 2 minutes:</li>
</ul>
<p><img src="https://dev-to-uploads.s3.amazonaws.com/uploads/articles/u4hddsk18j26961ncyyv.png" alt="time range"></p>
<ul>
<li>After the time range has been reduced to 2 minutes, you should be able to see some metrics displayed in graphs, etc:</li>
</ul>
<p><img src="https://dev-to-uploads.s3.amazonaws.com/uploads/articles/94pt41btscvqg5f6fmlt.png" alt="Metrics"></p>
<p>With that set, you can visualise your database metrics with the prebuilt dashboard just set up.</p>
<h2>
<a name="conclusion" href="#conclusion">
</a>
Conclusion
</h2>
<p>Throughout this comprehensive three-part article series, we covered a comprehensive setup of a LAMP stack application, containerization of the application, and effectively monitoring of the application.</p>

Top comments (0)